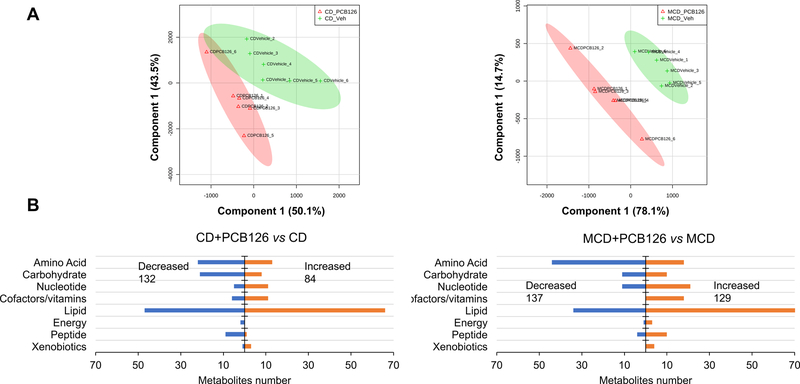
Figure 1. Global metabolomic analysis of liver samples from CD- and MCD-fed mice in response to PCB 126.
(A) Partial least squares with discriminant analysis (PLS-DA) revealed distinctive changes of the metabolome after PCB 126 exposure in both CD and MCD groups. (B) Categorization of metabolites change significantly after PCB 126 exposure based on two-way ANOVA (p<0.05, fold change≥ 1 or <1) of normalized LC-MS data.

