
Figure 2. Metabolome view from pathway analysis performed using MetaboAnalyst.
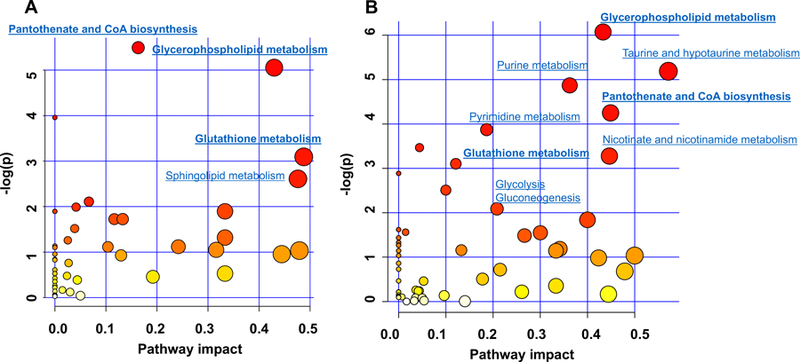
(A) Pathways that have been changed due to PCB 126 exposure in CD-fed mice. (B) Pathways that have been changed due to PCB 126 exposure in MCD-fed mice. Pathways were plotted according to hypergeometric test p-value (vertical axis, shades of red) and impact factor (horizontal axis, circle diameter).