
Figure 4. Metabolism and relative levels of thiol metabolites in mice liver.
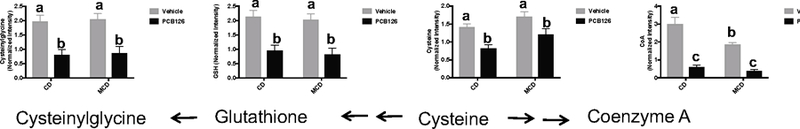
Bars represent mean ± S.E.M. of six animals in each group. The LC-MS peak areas for metabolites were log transformed and normalized with median value. Different subscript letters (a, b, c) indicate statistical significance (p<0.05) by two-way ANOVA analysis.