Fig. 5.

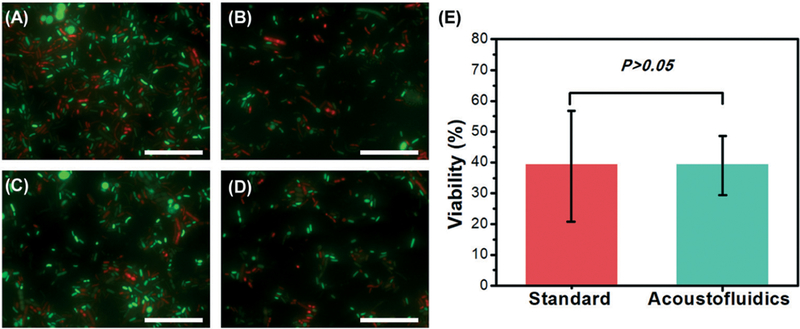
Different fluorescence microscope images (100×) of Live/Dead BacLight stained liquefied stool samples prepared using: (A) and (B) a standard stool-liquefaction procedure; (C) and (D) our acoustofluidic stool liquefier. Green fluorescence represents live bacteria while red fluorescence refers to dead bacteria. (E) Comparison of bacterial cell viability for the two liquefaction methods. For each method, four independent experiments were conducted, and over 2800 bacterial cells were counted. P > 0.05 (ANOVA) represents that no significant difference between the two groups is observed. Scale bar: 50 μm.
