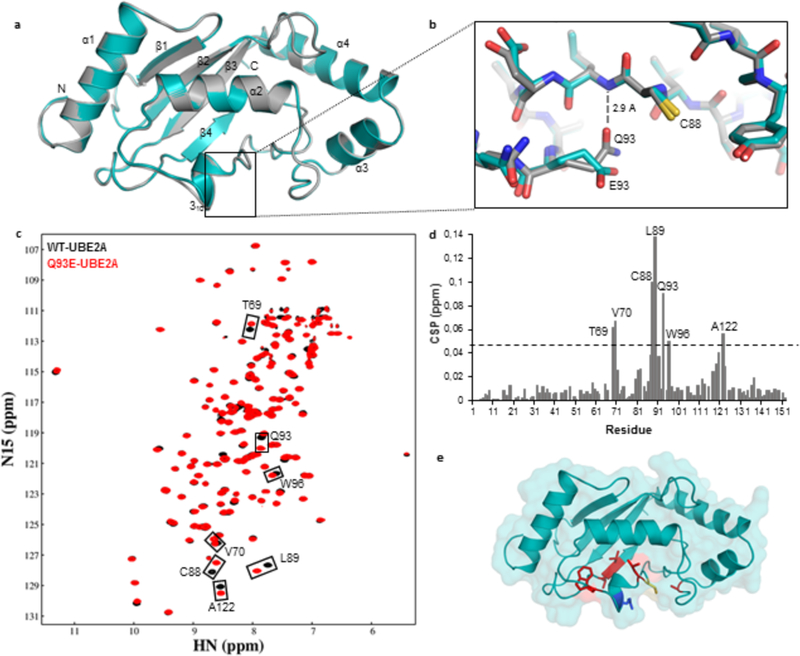
Figure 2: Structural comparison between wild-type and Q93E human UBE2A.

(A) Ribbon representation of wild-type UBE2A (grey) and Q93E mutant (cyan) crystal structures, superposed. (B) Close up view of Q93E mutation from (A) highlighting the interactions made by Q93 sidechain. The nearby catalytic residue C88 is also indicated. (C) Overlay of (1H,15N)-HSQC spectra of 15N-labeled wild-type UBE2A (black) and Q93E mutant (red). Residues showing significant chemical shift perturbation (CSP) are indicated. (D) Graph showing the weighted CSP for each residue when introducing the Q93E mutation into UBE2A. The dashed line indicates twice the standard deviation above average. (E) Residues presenting the most significant CSPs are mapped in red on Q93E-UBE2A crystal structure. Catalytic Cys88 is colored in yellow and Q93E mutation is shown in blue.
