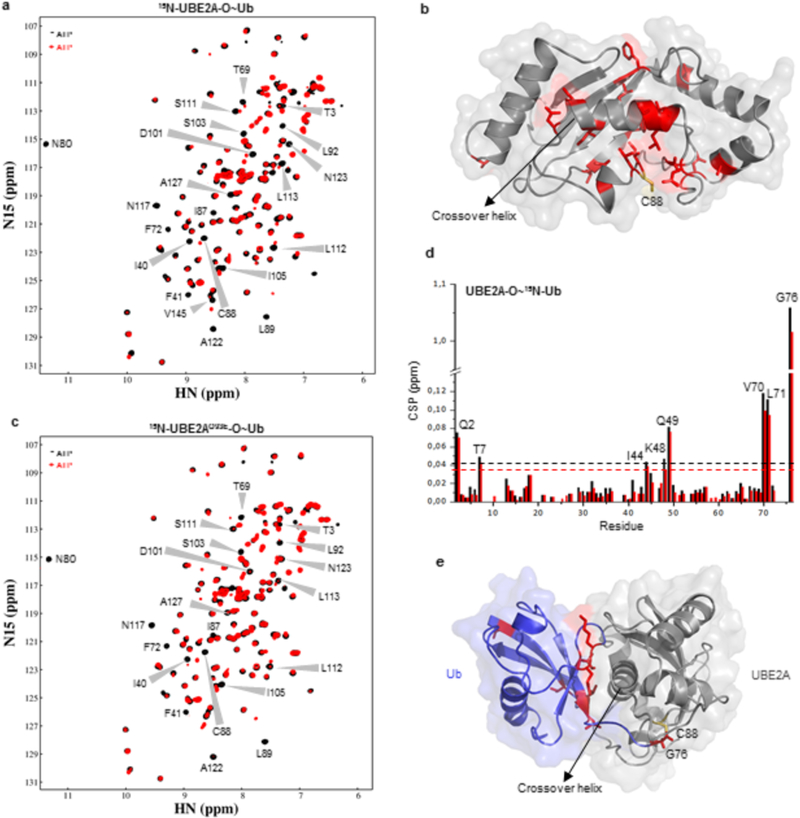
Figure 3: Comparison of wild-type and Q93E mutant UBE2A-O~Ub oxyester conjugates.

(A) (1H,15N)-HSQC spectra of 15N-C88S-UBE2A before (black) and after (red) addition of ATP, in the presence of E1, ubiquitin and Mg2+. Residues presenting CSPs larger than one standard deviation above the average after oxyester formation are indicated on spectra. (B) Mapping of residues perturbed in (A) upon conjugation with ubiquitin on WT UBE2A structure. Catalytic residue C88 is shown in yellow. (C) (1H,15N)-HSQC spectra of ubiquitin conjugation with 15N-C88S/Q93E-UBE2A. Black - before ATP addition; Red - after ATP addition. (D) CSP chart of 15N-Ub upon conjugation with C88S-UBE2A (black) or C88S/Q93E-UBE2A (red) (corresponding to spectra in Supplementary Figure 6A). Dashed lines indicate one standard deviation above the average. (E) CSP mapping onto the structural model of UBE2A~Ub showing Ub residues that experienced significant NMR chemical shift changes. Catalytic cysteine C88 is indicated in yellow.
