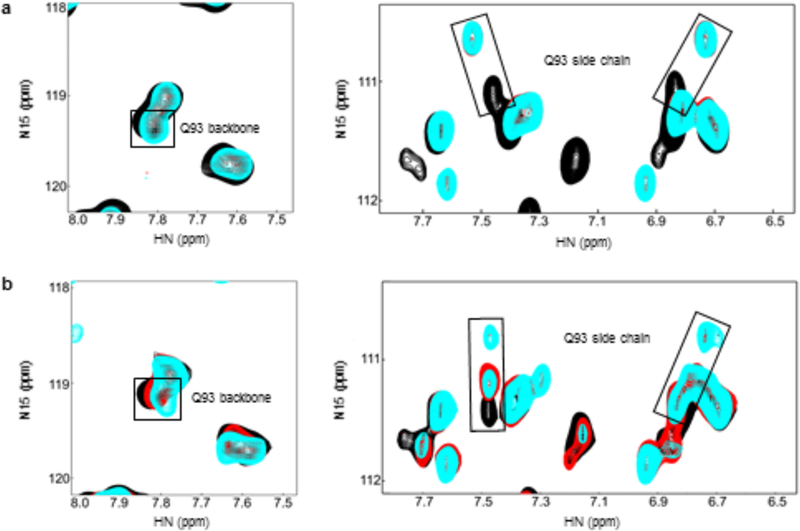
Figure 4: Monitoring of the Q93 residue during UBE2A catalysis.

(1H,15N)-HSQC spectra of (A) 15N-C88S-UBE2A during oxyester linkage formation and (B) 15N-WT- UBE2A during thioester linkage formation, showing the peaks correspondent to Q93 backbone and Q93 sidechain. Black - before ATP addition, red - right after ATP addition, cyan - 5 hours after ATP addition.
