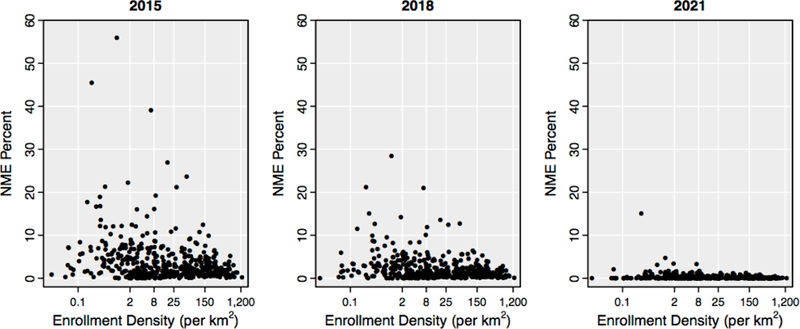
Figure 6. NME percent and Enrollment Density for CA school districts in 2015, 2018, and 2021.

Enrollment density is plotted on a log scale, given the highly skewed data distribution.

Enrollment density is plotted on a log scale, given the highly skewed data distribution.