
Figure 2.
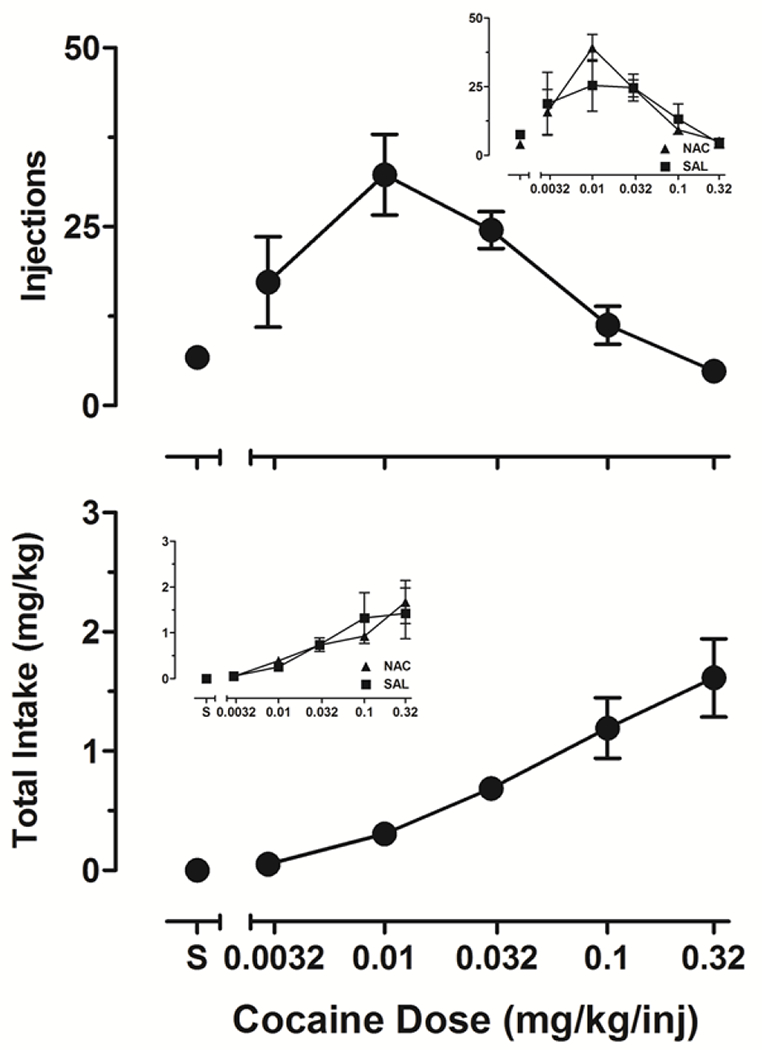
Average (±SEM) cocaine infusions (upper panel) and total cocaine intake (lower panel) during 1-h sessions in which different unit doses of cocaine (mg/kg/inj) and saline (S) were self-administered (n=6). The insets in show the same data from the larger panels divided by subjects that would, in later conditions, comprise the NAC (n=3) and saline (n=3) groups.