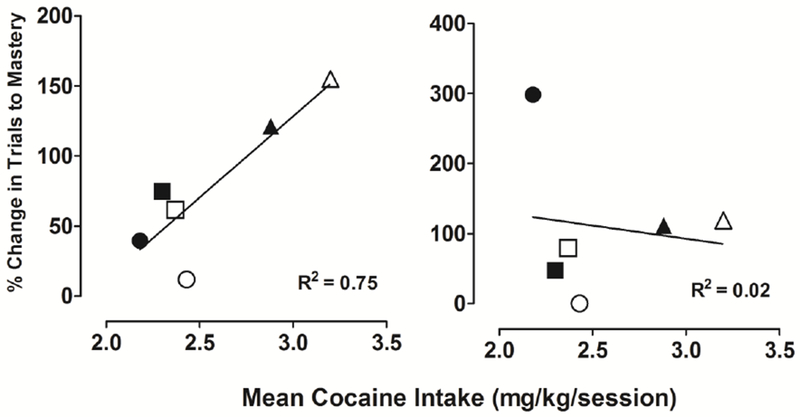
Figure 4.

Percent change from baseline in average trials to master 5 discriminations (left panel) and 5 reversals (right panel) following 30 days of cocaine self-administration, plotted as a function of average daily cocaine intake during the sessions in which those 5 discriminations were mastered. Each data point represents that relationship for an individual subject. The solid line represents a standard linear regression fit to the data.
