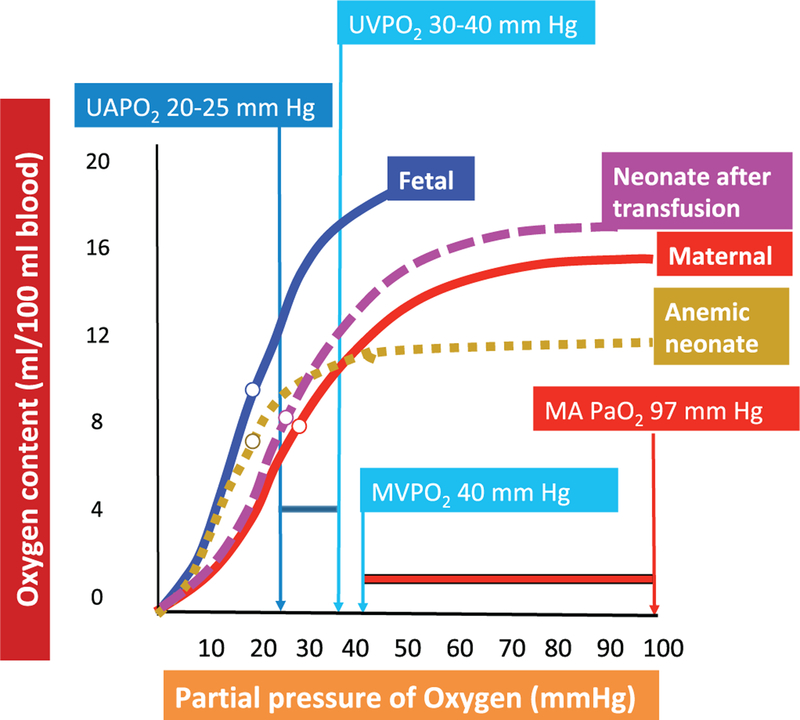
Fig. 1.
Oxyhemoglobin dissociation curve (CaO2 versus PaO2). The higher oxygen affinity of fetal hemoglobin (blue curve) shifts the oxygen dissociation curve to the left, which results in a greater release in oxygen at a lower partial pressure of oxygen (PO2) compared with adult hemoglobin (red curve). Only a small change in PO2 (≈10 mm Hg) from the higher oxygenated fetal venous blood (30–40 mm Hg) to the arterial blood (20–30 mm Hg) results in a release of ≈25% of oxygen to the tissues. In the pregnant woman, however, a similar release in oxygen from adult hemoglobin requires a drop from the arterial PO2 (97 mm Hg) to the venous PO2 (40 mm Hg) of 57 mm Hg. In a neonate, anemia (hyphenated orange curve) is associated with lower CaO2 without any change in P50 (partial pressure of oxygen resulting in 50% oxygen saturation or 50% peak CaO2). P50 is shown as an open circle along the oxygen–hemoglobin dissociation curve. Transfusion with packed red cells from an adult source (with hemoglobin (Hgb) A) results in increased CaO2 and also an increase in P50 towards adult values. MAPO2, maternal arterial PO2; MVPO2, maternal venous PO2; UAPO2, umbilical artery PO2; UVPO2, umbilical vein PO2. Data from Rudolph (2009). Note that the oxyhemoglobin dissociation curve is often presented with SaO2 on the y-axis; we opted to present these data with CaO2 on the y-axis to more clearly demonstrate the impact of blood transfusion.

