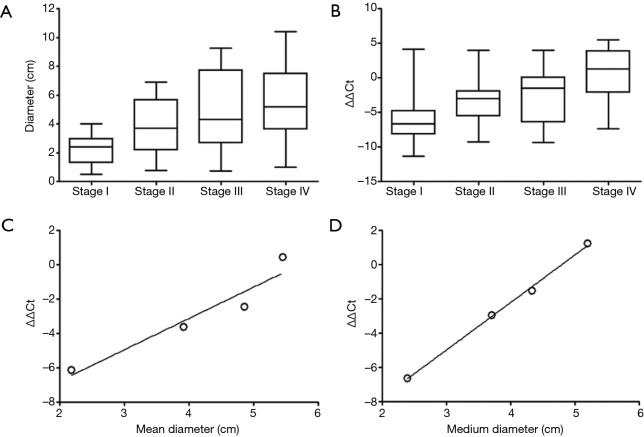
Figure 1.
The relationship between tumor diameter and plasma mSHOX2 methylation level (ΔΔCt). Box and Whisker plots show the diameter (A) and the ΔΔCt values (B) from stage I to stage IV lung cancer. The linear relationship between the mean values of diameter and the ΔΔCt was shown in (C) and the linear relationship between the medians of diameter and the ΔΔCt was shown in (D).

