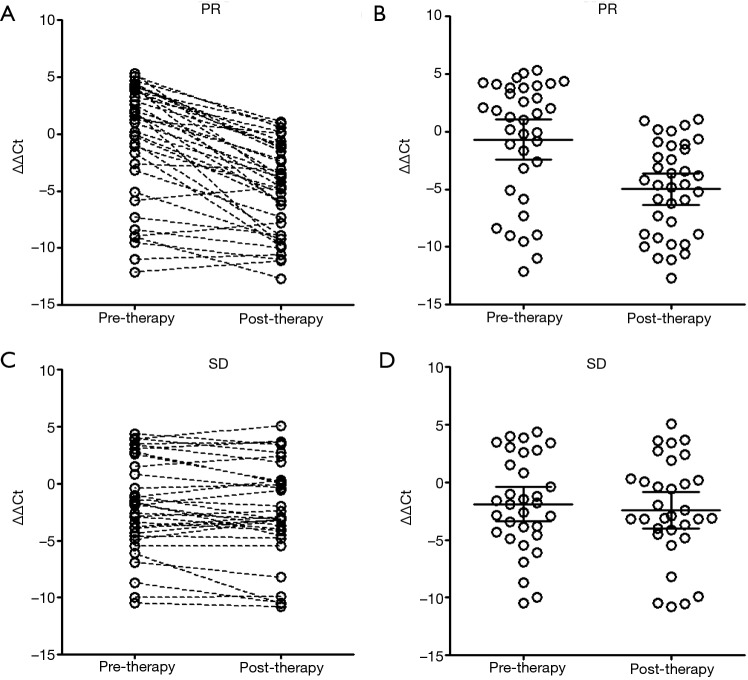
Figure 3.
The mSHOX2 levels before and two cycles after therapy for stage IV lung cancer patients with partial response (PR) or stable disease (SD). The before-after plot is shown in (A) and (C) for patients with PR and SD, respectively, and data from the same patient is connected by dashed line to show the mSHOX2 level change. The scatter plot is shown in (B) and (D) for patients with PR and SD, respectively, and bars represent mean values with 95% CI.

