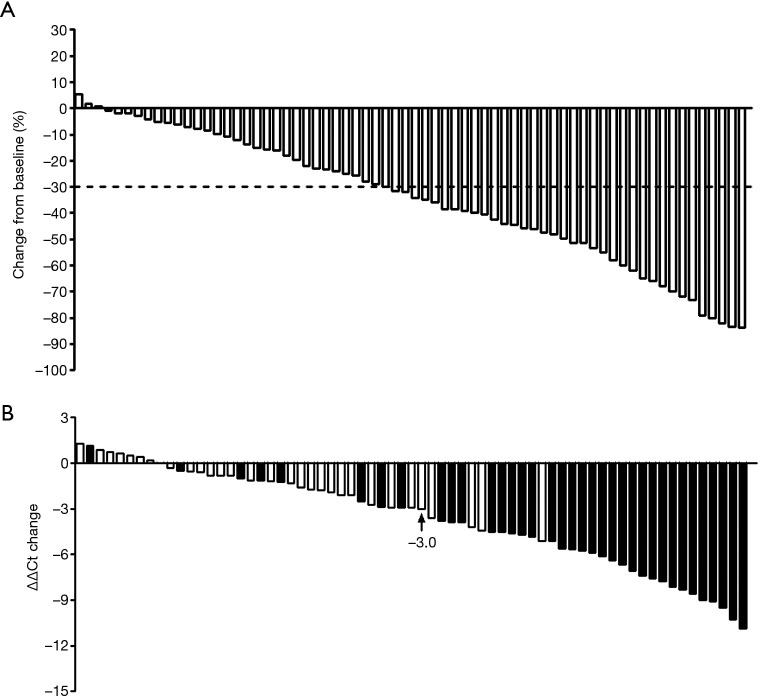
Figure 4.
The therapeutic response and the corresponding mSHOX2 level change (ΔΔCt change) for stage IV lung cancer patients. (A) The therapeutic response of all involved stage IV lung cancer patients in ascending order of the response. 30% threshold was used for distinguishing patients with PR from those with SD. (B) The ΔΔCt change of the corresponding patients in descending order. Positive numbers indicate ΔΔCt increase and negative numbers indicate ΔΔCt decrease. Solid bars represent the ΔΔCt change values for patients with PR and blank bars represent ΔΔCt change values for patients with SD. −3.0 (arrow) was the median value of the dataset, which was used in Figure 5 for patient dichotomization.

