Figure 6.
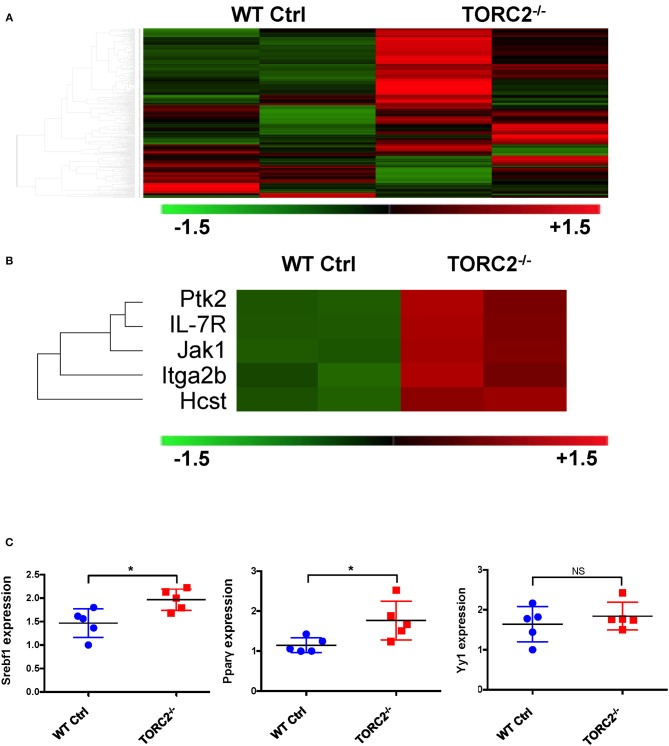
TORC2−/− DC exhibit a distinct gene expression profile from wild-type (WT) control (Ctrl) DC. (A) Expression of 378 genes comprised in the NanoString Mouse Immunology Panel, shown as a heat map. Red indicates increased gene expression and green indicates decreased gene expression compared to Ctrl DC; n = 2 mice in each group. (B) Selection highlighting 5 genes of interest,- upstream mediators of augmented Akt/TORC1 activity from the panel in (A), that were upregulated in TORC2−/− compared with Ctrl DC. (C) Expression of Srebf1, Pparγ, and Yy1 mRNA determined by RT-PCR in WT Ctrl DC and TORC2−/− DC and normalized to the housekeeping gene GAPDH, with Ctrl DC as the referent control; n = 5 mice per group, Student's “t”-test, *p < 0.05; NS, not significant.

