Figure 7.

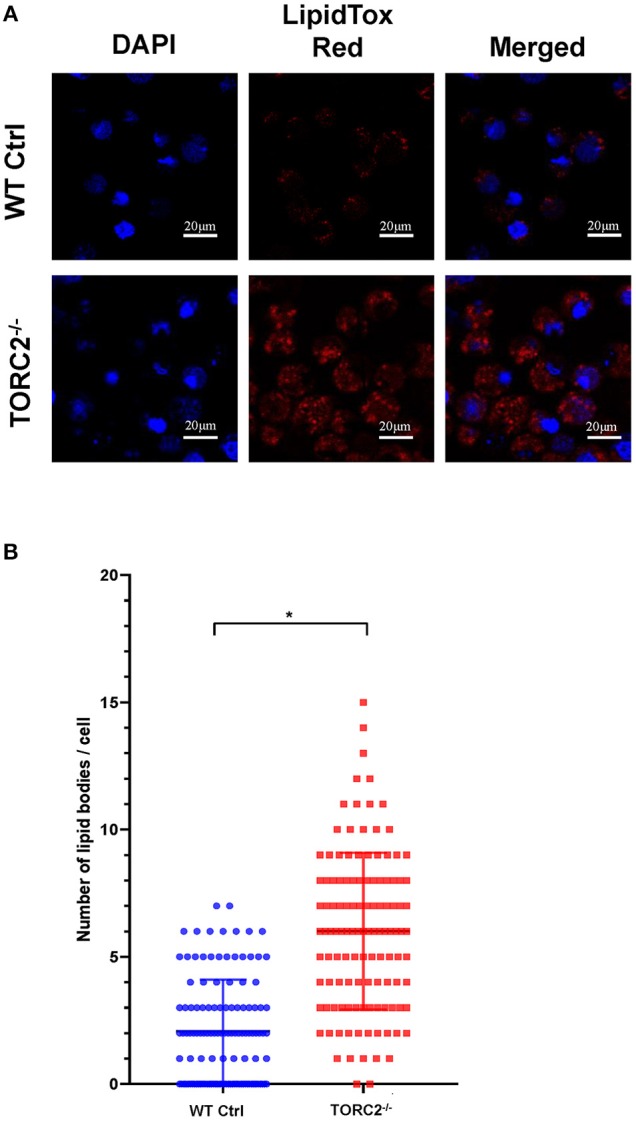
TORC2−/− DC display more lipid droplets (LDs) compared to wild-type (WT) control (Ctrl) DC. DC were generated from WT Ctrl or TORC2DC−/− mice (TORC2−/− DC) and prepared for confocal microscopy. (A) LDs were stained with HCS LipidTox Red (red). (B) Quantification of the number of LDs per cell. Results of a representative experiment out of two performed is shown. Sixty cells were analyzed for each condition in each experiment; Student's “t”-test, *p < 0.05.
