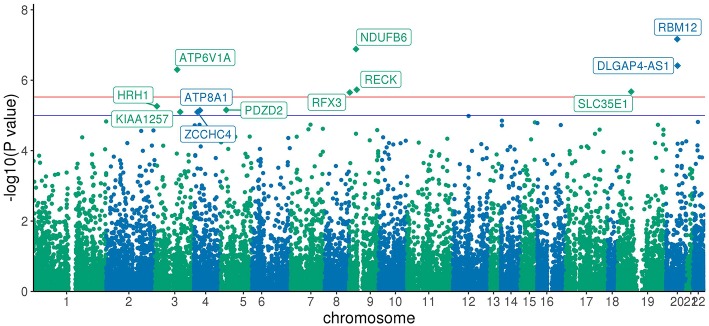
Figure 2.
Manhattan Plot of SKAT-O association results: Each point represents one of the 20,385 genes plotted against x-axis being chromosome position and y-axis log transformed SKAT-O p-value. All the genes above the red line are Bonferroni significant, and genes above the blue line have a p-value < 1 × 10⁻⁵.

