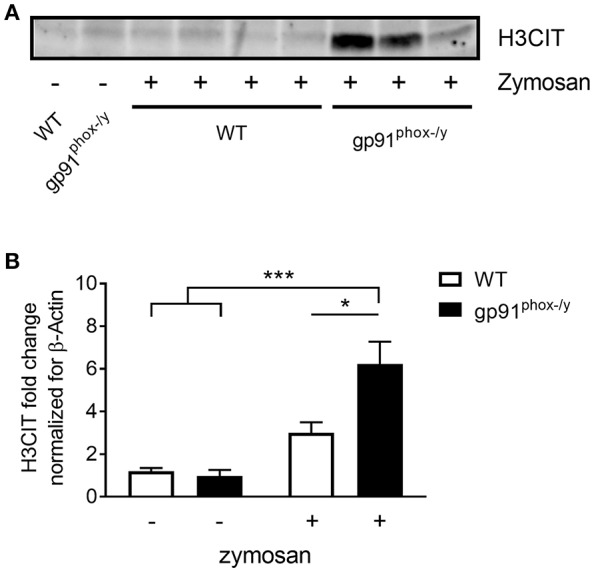
Figure 7.

Increased citrullinated H3 in the lung of gp91phox−/y mice following SIRS induction. (A) Representative immunoblot showing H3CIT protein from the lung of WT and gp91phox−/y mice 24 h after saline injection or SIRS induction by intraperitoneal zymosan. (B) Quantitation of H3CIT in the lung showing an increase in expression in the lung of gp91phox−/y mice, n = 5 saline injected and 7 zymosan injected, *p < 0.05, ***p < 0.001.
