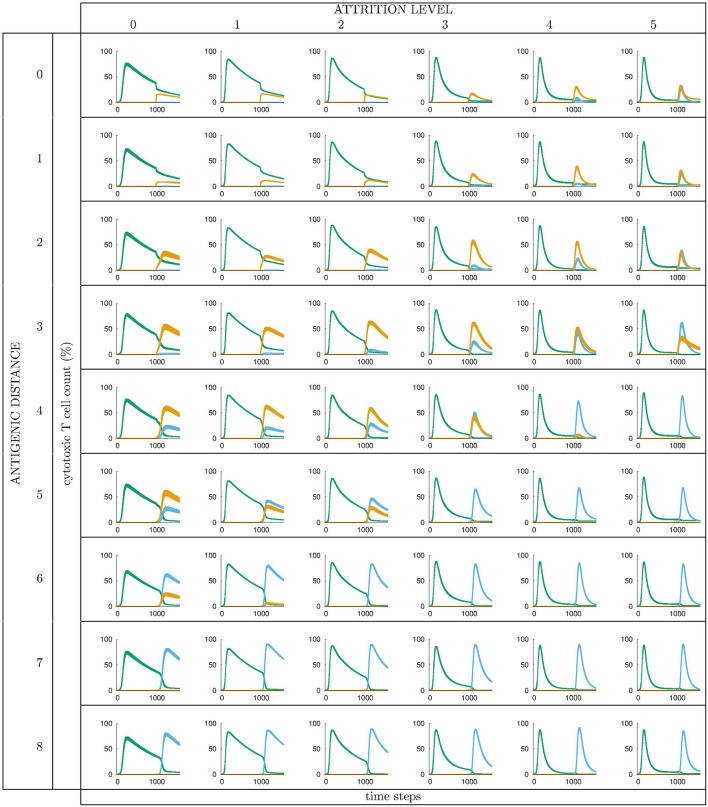
Figure 3.
Cytotoxic cell counts (percentage) vs. time. This is the result of different simulations obtained varying the level of attrition α = 0 … 5 (α = 0 is control case of no attrition) and the antigenic distance d between the two viral infections, for a total of 6 ×9 = 54 panels, each containing average ± standard deviation results of Tc counts in simulated primary viral infections, followed by a second challenge infection by an identical, or by a selected mutant virus. Color codes: green: response by naïve T effector cells to primary virus VI injected at tI = 0; orange: cross-reactive memory response primed by the first virus VI and challenged by VII; blue: response by naïve T effector cells to VII injected at tII = 1000 time steps. See text for further explanation.

