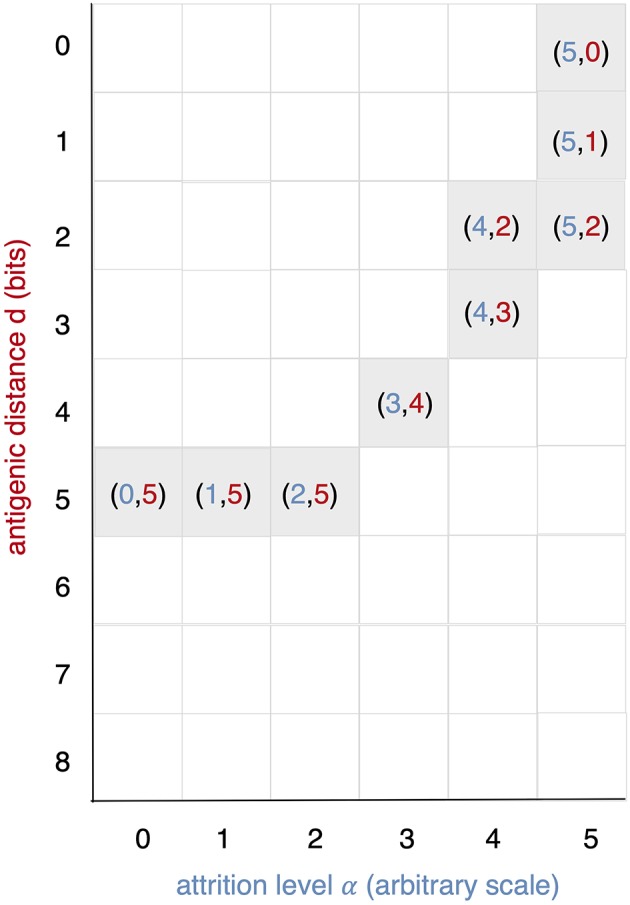
Figure 4.

This diagram is meant as a visual help to the analysis of Figure 3 and keeps on the same coordinates: virus distance (d = 0 … 8) vs. attrition level (α = 0 … 5). In Figure 3 we see that memory is strong and dominant but can be trimmed down by turning two independent knobs: the first increases d and affects affinity, the second through attrition, thins the memory cell population, by inducing apoptosis. If both knobs are turned up in the same run a synergic effect is observed. The equal counts of memory and naive cells are due to the fact that in the clearing of the virus that in the clearing of the virus the total affinity required is contributed equally by the two populations.
