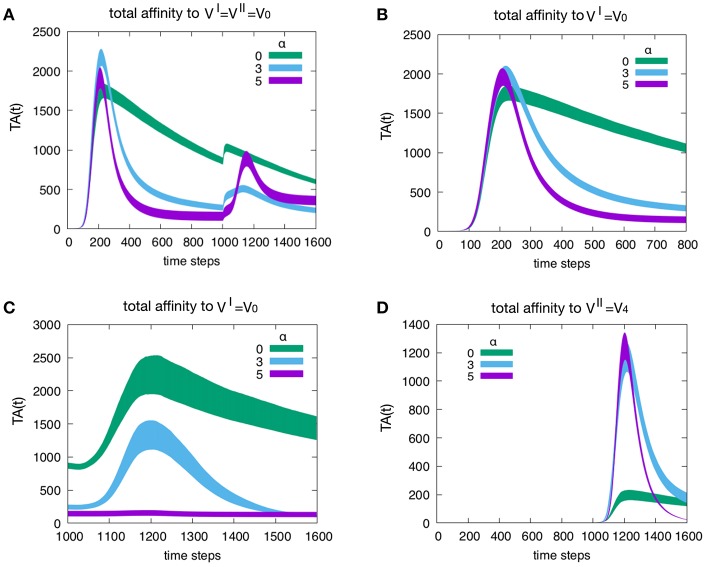
Figure 5.
Effect of attrition on the Tc total affinity TA(t). Panel (A) shows how the attrition influences the total affinity in a d = 0 experiment, i.e., the homologous response to . Only three levels of attrition shown. The highest level of attrition (α = 5) does not affect the peak of memory (in the homologous response the second peak is due to memory recall) but trims the curve via its effect on aged cells. In other words, as expected, the attrition facilitates the emergence of higher affinity cells thus increasing the peak values of the total affinity especially in the primary response. This will be shown more clearly in Figure 6. Panel (B) When simulating a heterologous response (i.e., heterologous challenge thus for viral distance d = 4), the total affinity to the VI = V0 is equivalent to the one in panel (A). Panel (C) shows the same total affinity to but calculated at the time of the challenge that is during the competing presence of anti-V4 naïve cells. Here, by increasing the level of attrition, the memory to disappears; this effect is striking when compared to the absence of attrition case of the green curve. Panel (D) once more shows the total affinity in a d = 4 experiment but this time relative to the virus injected as challenge, i.e., . The comparison of the total affinity should be made with respect to the peak values for t>1000 in panel A. Clearly, attrition has favored the emergence of higher affinity clones (blue and purple corresponding to α = 3 and 5, respectively) with respect to the absence of affinity case (green curve).

