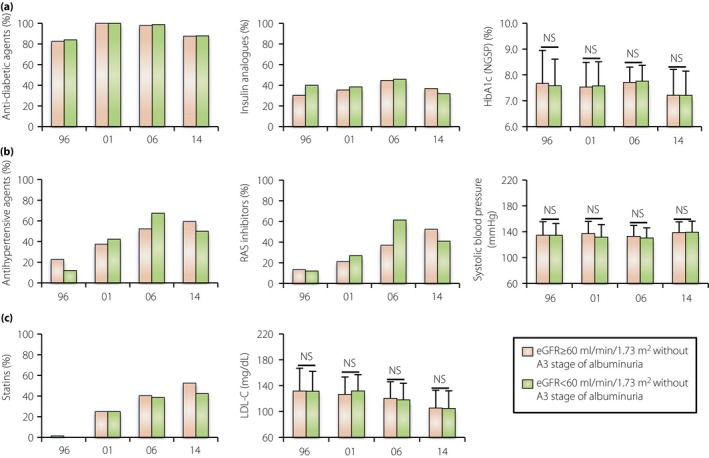
Figure 3.

Changes in the clinical characteristics of patients with type 2 diabetes with different categories of estimated glomerular filtration rate (eGFR) decline without macroalbuminuria. (a) The rate of use of any anti‐diabetic agents and insulin analogs and the hemoglobin A1c (HbA1c) level in the different eGFR stages in the 1996, 2001, 2006 and 2014 cohorts. (b) The rate of use of any antihypertensive agents and renin–angiotensin system (RAS) inhibitors and the systolic blood pressure in the different cohorts. (c) The rate of use of statins and the low‐density lipoprotein cholesterol (LDL‐C) level in the different cohorts. Data are the mean ± standard deviation. NS, not statistically significant.
