Figure 1.

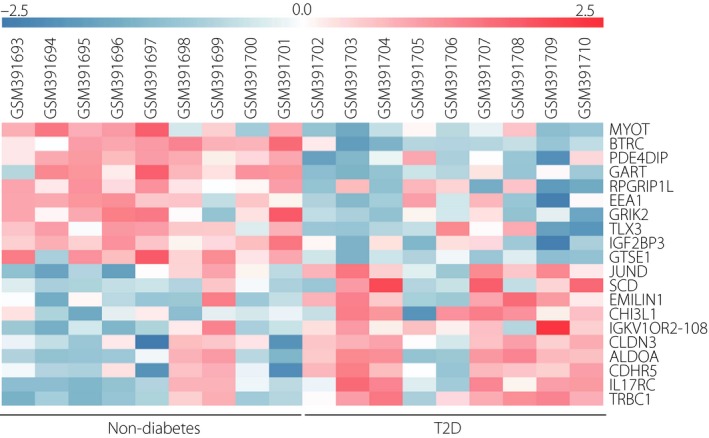
Heatmap of the top 10 upregulated and downregulated differentially expressed genes in GSE15653 Red, upregulation; blue, downregulation. T2D, type 2 diabetes.

Heatmap of the top 10 upregulated and downregulated differentially expressed genes in GSE15653 Red, upregulation; blue, downregulation. T2D, type 2 diabetes.