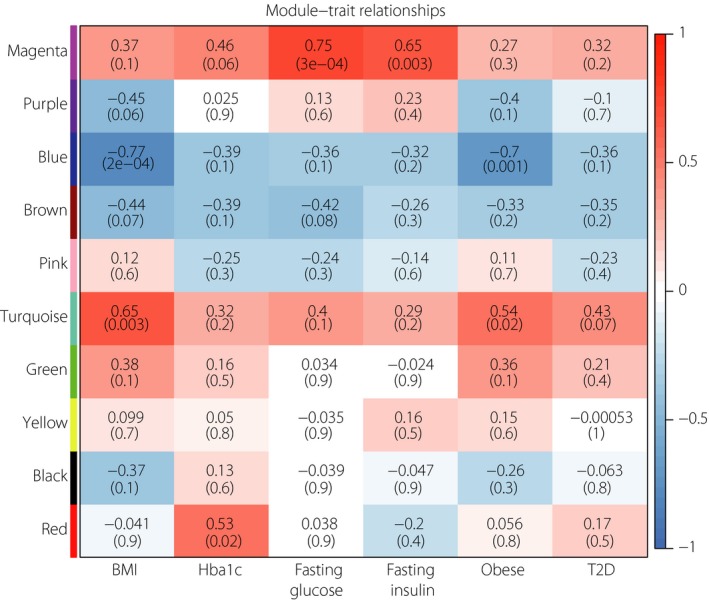
Figure 6.

Correlation between modules and clinical traits. Red represents positive correlation and blue represents negative correlation. The number in the top line of each cell indicates the robust correlation, and the number in the parentheses of each cell indicates the corresponding asymptotic P‐value. BMI, body mass index; HbA1c, hemoglobin A1c, T2D, type 2 diabetes.
