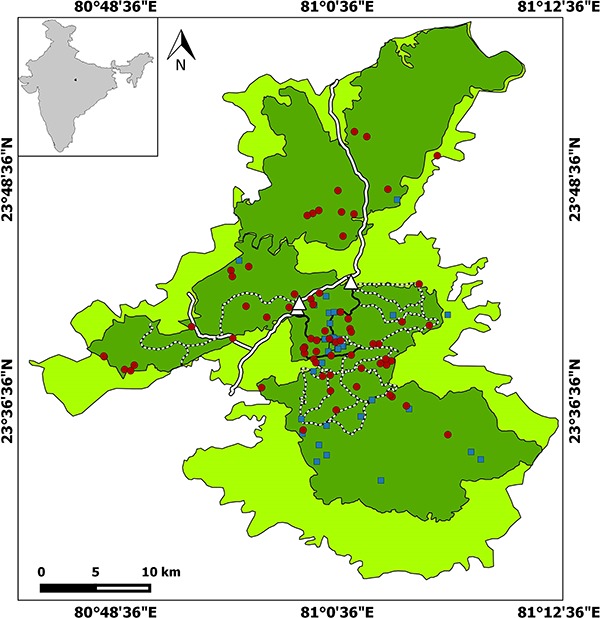
Figure 1.

Map showing BTR sample locations and tourist routes (solid black line, ≥51 vehicles per day; dotted line, <50 vehicles per day; white thick line, state highway road). Red round represents samples collected during tourism period, while the blue square represents sample collected during the non-tourism period. Dark green colour in the map is core zone while florescent colour is buffer zone. The white triangle is the entry point to the park.
