Abstract
Aims/Introduction
The aim of the present study was to identify candidate differentially expressed genes (DEGs) and pathways using bioinformatics analysis, and to improve our understanding of the cause and potential molecular events of diabetic nephropathy.
Materials and Methods
Two cohort profile datasets (GSE30528 and GSE33744) were integrated and used for deep analysis. We sorted DEGs and analyzed differential pathway enrichment. DEG‐associated ingenuity pathway analysis was carried out. The screened gene expression feature was verified in the db/db mouse kidney cortex. Then, rat mesangial cells cultured with high‐concentration glucose were used for verification. The target genes of transcriptional factor E26 transformation‐specific‐1 (ETS1) were predicted with online tools and validated using chromatin immunoprecipitation assay quantitative polymerase chain reaction.
Results
The two GSE datasets identified 89 shared DEGs; 51 were upregulated; and 38 were downregulated. Most of the DEGs were significantly enriched in cell adhesion, the plasma membrane, the extracellular matrix and the extracellular region. Quantitative reverse transcription polymerase chain reaction analysis validated the upregulated expression of Itgb2, Cd44, Sell, Fn1, Tgfbi and Il7r, and the downregulated expression of Igfbp2 and Cd55 in the db/db mouse kidney cortex. Chromatin immunoprecipitation assay quantitative polymerase chain reaction showed that Itgb2 was the target gene of transcription factor Ets1. ETS1 knockdown in rat mesangial cells decreased integrin subunit beta 2 expression.
Conclusion
We found that EST1 functioned as an important transcription factor in diabetic nephropathy development through the promotion of integrin subunit beta 2 expression. EST1 might be a drug target for diabetic nephropathy treatment.
Keywords: Bioinformatics analysis, Diabetic nephropathy, Differentially expressed genes
Introduction
Diabetic nephropathy (DN) has emerged as the main cause of end‐stage renal disease, but current treatments are still suboptimal. Some genetic and environmental factors can be used to show the pathogenesis of DN. These factors contribute to the progressive and irreversible scarring of the glomeruli and tubulointerstitial parts of the kidneys, leading to the regression of renal function, eventually leading to renal failure. Genome‐wide transcriptome analysis using expression arrays can be used to identify biomarkers for disease progression, and to gain insights into the disease pathogenesis and molecular classification1. With the wide application of genome transcriptome analysis, a large amount of core slice data has been produced, most of which is already stored in a public database. Re‐analyzing these data can provide significant clues for other research. In recent years, some microarray data analysis studies on DN have been carried out, and numerous differentially expressed genes (DEGs) have been identified2. Because of the heterogeneity of the tissues or samples in independent studies, most of the gene array results are either limited or inconsistent, focused on human DN or generated from a single cohort study. We combine integrated bioinformatics methods and expression profiling techniques to address these disadvantages.
In the present work, we downloaded two original microarray datasets, GSE305283 and GSE337444, from the National Center for Biotechnology Information‐Gene Expression Omnibus (NCBI‐GEO) database (available online: https://www.ncbi.nlm.nih.gov/geo). Gene expression was profiled in a cohort of type 2 DN patients and in a diabetic BKS db/db mouse model of DN. We filtered DEGs using the Morpheus website. Then, we developed a Gene Ontology (GO) analysis and pathway enrichment analysis for the screening of DEGs5, and we integrated a DEG ingenuity pathway analysis (IPA) to identify hub genes in DN.
Methods
Microarray Data Information and DEG Analysis
We obtained two DN renal tissue gene expression profiles, namely GSE30528 and GSE33744, from the NCBI‐GEO database. The raw data were analyzed with the Morpheus website. DEGs were identified with a classical t‐test, and statistically significant DEGs were defined using P < 0.05 and [logFC] >1 as the cut‐off criteria. KEGG PATHWAY, Reactome, BioCyc, Panther5, NHGRI and the GO website were used for GO and pathway analysis6, 7 (P < 0.05 was the cut‐off criterion). IPA (Ingenuity Systems, Redwood City, CA, USA) was used to analyze biological functions, upstream regulatory molecules/networks, DEG network interactions and pathways.
Experimental Animals and Procedures
The present study was carried out according to the Guide for the Care and Use of Laboratory Animals of the Chinese PLA General Hospital and Military Medical College; the Animal Ethics Committee of the Chinese PLA General Hospital and Military Medical College approved this study.
We used db/db mice with the nephropathy‐susceptible BKS background8 as a model of type 2 diabetes, and db/m mice as the control group. We purchased mice from the Model Animal Research Center of Nanjing University (Nanjing, China). The animals were provided with adequate standard rodent chow and water. The 26‐week‐old male mice were divided into two groups: (i) the control group, namely, db/m mice (n = 8); and (ii) the DN group, namely, db/db mice (n = 8). Twenty‐six weeks old mice were placed in metabolic cages to collect 24‐h urine samples. At the end of 26 weeks, mice were euthanized. The fasting blood glucose level was also measured in all groups. Both kidneys were removed and weighed, and the kidneys were harvested for further processing.
Cell Culture and Transfection
Rat mesangial cells (RMCs) were purchased from American Type Culture Collection. RPMI 1640 medium (Gibco, Grand Island, NY, USA) containing 10% fetal bovine serum (HyClone Ottawa, Ontario, Canada) at 37°C in a 5% CO2 atmosphere was used for cell culture. RMCs were cultured for 48 h in normal (5.5 mmol/L) glucose medium or high (30 mmol/L) D‐glucose medium; 24.5 mmol/L mannitol was added to the normal glucose medium as an osmotic control. E26 transformation‐specific‐1 (ETS1) and integrin subunit beta 2 (ITGB2) small interfering ribonucleic acid (siRNA) or control siRNA (siRNA‐con: a scrambled siRNA(5′‐UCAAGAAGCCAAGGAUAAU‐3′) (GenePharma, Shanghai, China; 100 nmol/L) was transfected into RMCs for 48 h using jetPRIME™ (Polyplus‐transfection, Strasbourg, France). Then, ETS1 and ITGB2 protein expression were assessed by western blotting.
Western Blot Analysis
Radioimmunoprecipitation assay lysis buffer containing 50 mmol/L Tris‐HCl, pH 7.5, 150 mmol/L NaCl, 0.5% deoxycholate, 1% Nonidet P‐40, 0.1% sodium dodecyl sulfate, 1 mmol/L phenylmethylsulfonyl fluoride and 1 μg/mL protease cocktail was used to extract protein from cells and tissues. A bicinchoninic acid assay kit was used to determine the protein concentration. Protein samples (80 μg/lane) were loaded onto gels, separated by 10% sodium dodecyl sulfate polyacrylamide gel electrophoresis and transferred to polyvinylidene difluoride membranes. Then, the membranes were incubated with anti‐Ets1, Igtb2 or β‐actin antibodies at 4°C overnight. The membrane was washed three times and incubated with a secondary antibody for 1 h. The detection of specific signals was carried out using enhanced chemiluminescence (Amersham Biosciences, Little Chalfont, UK).
Real‐Time Polymerase Chain Reaction and Chromatin Immunoprecipitation Assay
To validate the results of the high‐throughput microarray analysis, Itgb2, Cd44, Sell, Fn1, Tgfbi, Il7r, Igfbp2 and Cd55 were selected and analyzed by quantitative polymerase chain reaction (qPCR). The primers are listed in Table S1. Chromatin immunoprecipitation assay (ChIP) assays were carried out using a kit from Millipore, Inc. (Milford, MA, USA). The PCR primers used for ChIP assays were as follows: Itgb2 forward, 5′‐CCTGCAGATTGTTCCGGAGT‐3′ and Itgb2 reverse, 5′‐CTGGGGCCACCTTTACTGAG‐3′. The 2−ΔΔCT method was used to calculate the relative amplification of the promoter sequence of each gene.
Statistical Analysis
Results are presented as the mean ± standard deviation. Statistical analyses were carried out with SPSS 17.0 statistical software (SPSS, Inc., Chicago, IL, USA). Student's t‐test was used to assess the significance of experimental differences between groups. A P value <0.05 was considered statistically significant.
Results
Identification of DEGs in DN
Figure 1 shows the workflow of the present study. Using the free NCBI‐GEO database, we obtained the gene expression profiles of GSE30528 and GSE33744 with the DN renal tissue database. The microarray data of GSE30528 had 22 microdissected human glomerular samples3. The glomerular samples were collected from healthy, living transplant donors; nephrectomies; and diagnostic kidney biopsies. For the glomerular analysis, nine DN and 13 control samples had been chosen. The GSE33744 data included 10 renal glomerular samples from five diabetic BKS db/db mice and five non‐diabetic BKS db/m mice4. The diabetic BKS db/db mice were an obese type 2 diabetes model with a C57BLKS genetic background combined with a homozygous leptin receptor mutation (lepr db/db; BKS db/db mice). We obtained 685 and 1,197 DEGs from the expression profile datasets of GSE30528 and GSE33744 using P < 0.05 and [logFC] >1 as cut‐off criteria, respectively. Among the DEGS, 89 were consistently expressed genes; 51 that were upregulated and 38 that were downregulated in the DN glomerular tissues compared with normal glomerular tissues were identified from the two profile datasets (Figure 2a; Table 1). The heat map showed the significantly different distribution of the 89 DEGs using the GSE30528 data profile as the reference with the Morpheus software (Figure 2b).
Figure 1.
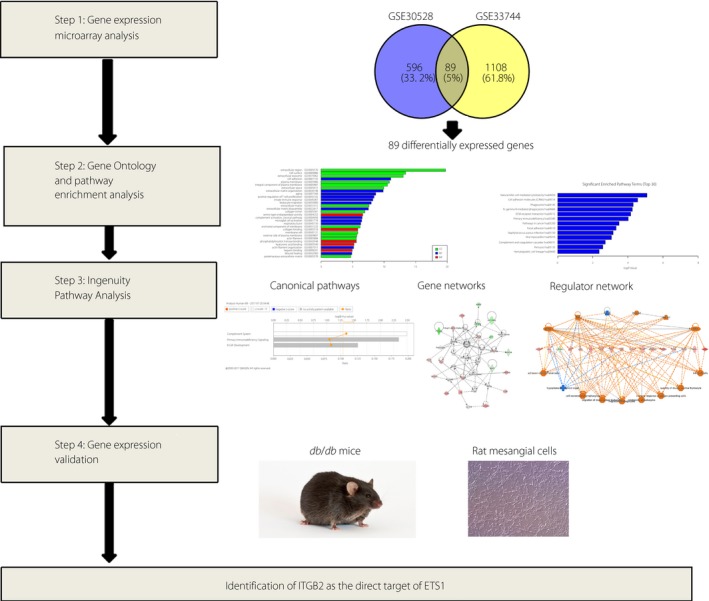
Workflow of the study. ETS1, E26 transformation‐specific‐1; ITGB2, integrin subunit beta 2.
Figure 2.
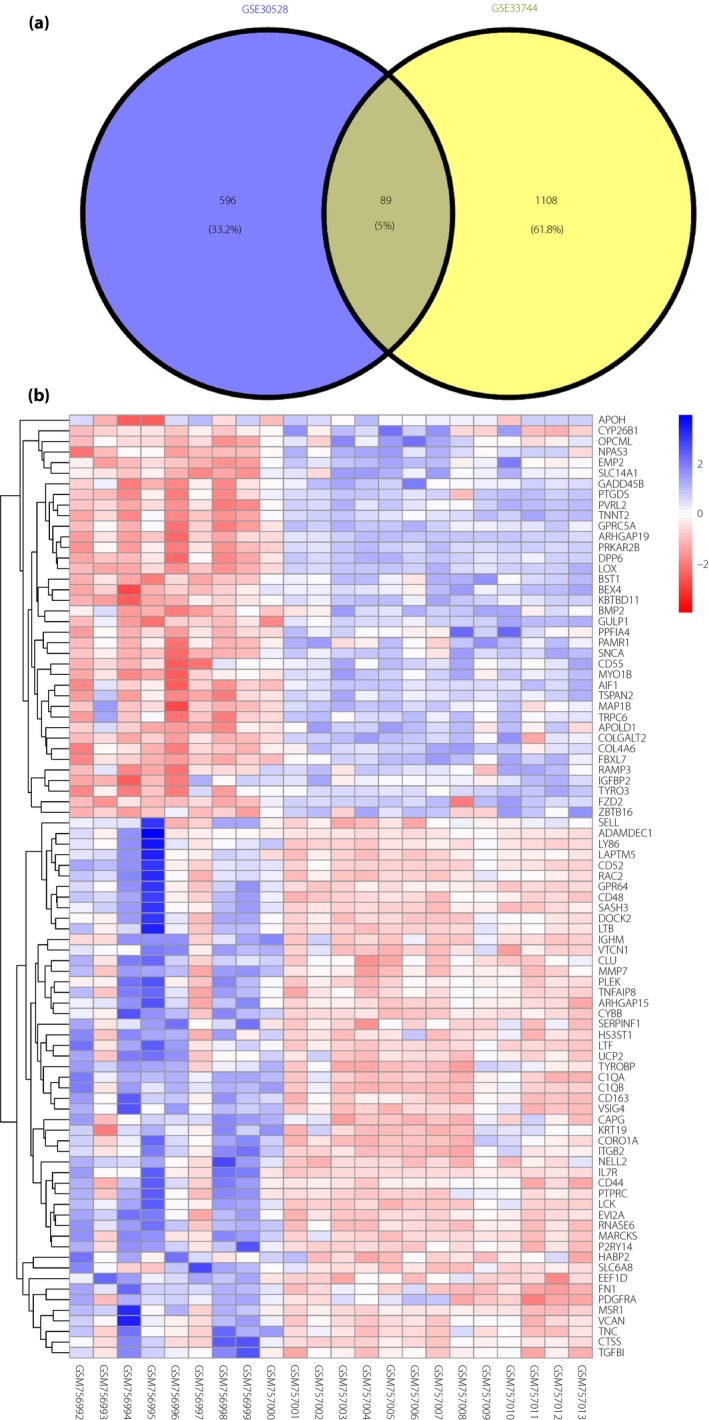
Identification of 89 commonly changed differentially expressed genes (DEGs) from the two cohort profile datasets (GSE30528 and GSE33744). (a) Different color areas represent different datasets. The cross areas indicate commonly changed DEGs. (b) Heat map of the top 89 DEGs (51 upregulated genes and 38 downregulated genes). Red, upregulation; blue, downregulation.
Table 1.
Differentially expressed genes identified from two profile datasets
| DGEs | Gene names |
|---|---|
| Upregulated | ADAMDEC1, ARHGAP15, C1QA, C1QB, CAPG, CD163, CD44, CD48, CD52, CLU, CORO1A, CTSS, CYBB, DOCK2, EEF1D, EVI2A, FN1, GPR64, HABP2, HS3ST1, IGHM, IL7R, ITGB2, KRT19, LAPTM5, LCK, LTB, LTF, LY86, MARCKS, MMP7, MSR1, NELL2, P2RY14, PDGFRA, PLEK, PTPRC, RAC2, RNASE6, SASH3, SELL, SERPINF1, SLC6A8, TGFBI, TNC, TNFAIP8, TYROBP, UCP2, VCAN, VSIG4, VTCN1 |
| Downregulated | AIF1, APOH, APOLD1, ARHGAP19, BEX4, BMP2, BST1, CD55, COL4A6, COLGALT2, CYP26B1, DPP6, EMP2, FBXL7, FZD2, GADD45B, GPRC5A, GULP1, IGFBP2, KBTBD11, LOX, MAP1B, MYO1B, NPAS3, OPCML, PAMR1, PPFIA4, PRKAR2B, PTGDS, PVRL2, RAMP3, SLC14A1, SNCA, TNNT2, TRPC6, TSPAN2, TYRO3, ZBTB16 |
The two profile datasets included 51 upregulated genes and 38 downregulated genes in the diabetic nephropathy glomerular tissues, compared with normal glomerular tissues. DGEs, differentially expressed genes; DN, diabetic nephropathy.
DEG GO Analysis in DN
Candidate DEG functions and pathway enrichment were analyzed using multiple online databases, including DAVID, KEGG PATHWAY, BioCyc, Panther5, NHGRI and the GO website6, 7, 9. DEG GO analysis was carried out by DAVID and Panther. The DEGs were classified into three groups, namely, cellular component, biological process and molecular function (Figure 3a). As shown in Figure 3b, in the biological process group, DEGs were mainly enriched in cell adhesion, extracellular matrix organization, aging, positive regulation of T‐cell proliferation and extracellular matrix disassembly. In the molecular function group, DEGs were mainly enriched in serine‐type endopeptidase activity, collagen binding, phosphatidylinositol 3‐kinase binding, hyaluronic acid binding and heparin binding. In the cellular component group, DEGs were mainly enriched in the cell surface, extracellular region, plasma membrane, extracellular exosome, integral component of plasma membrane and extracellular space. These results showed that most of the DEGs were significantly enriched in the extracellular region, extracellular matrix, cell adhesion and plasma membrane.
Figure 3.
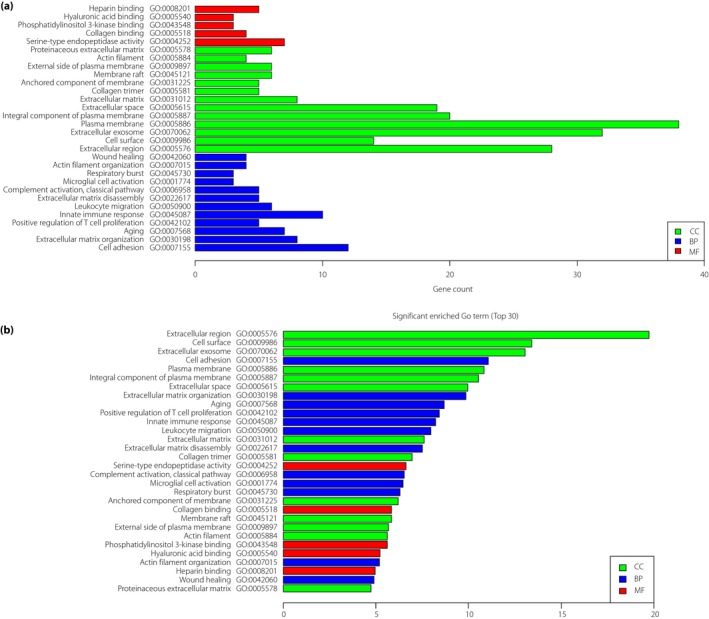
Gene Ontology (GO) analysis and significantly enriched GO terms of differentially expressed genes in diabetic nephropathy. (a) GO analysis classification of differentially expressed genes in three groups. (b) Significantly enriched GO terms of differentially expressed genes in diabetic nephropathy based on function. BP, biological process; CC, cellular component; MF, molecular function.
Signaling Pathway Enrichment Analysis
KEGG PATHWAY, Reactome, BioCyc, Panther, NHGRI and GO were carried out for the DEG functional and signaling pathway enrichment. Signaling pathway analysis showed that DEGs were mainly enriched in natural killer cell‐mediated cytotoxicity, cell adhesion molecules (CAMs), phagosome, Fc gamma R‐mediated phagocytosis, ECM–receptor interaction, primary immunodeficiency, pathways in cancer, focal adhesion, Staphylococcus aureus infection, viral myocarditis, complement and coagulation cascades, pertussis, and hematopoietic cell lineage (Figure 4; Table S2).
Figure 4.

Significantly enriched pathway terms of differentially expressed genes in diabetic nephropathy. Differentially expressed gene functional and signaling pathway enrichment was carried out using the following online websites: KEGG PATHWAY, Reactome, BioCyc, Panther, NHGRI and Gene Ontology.
Key Candidate Gene and Pathway Identification with DEG IPA
We carried out biological functions, pathways and upstream regulatory molecules/networks analysis for 89 DEGs using the QIAGEN IPA (QIAGEN, Redwood City, CA, USA; www.qiagen.com/ingenuity).
Canonical Pathways Identified in IPA
IPA showed that the ingenuity canonical pathways were focused on the following three canonical pathways: the complement system (P = 0.003; ratio 0.108), containing ITGB2, CD55, C1QA and C1QB; primary immunodeficiency signaling (P = 0.004; ratio 0.083), containing PTPRC, IL7R, LCK and IGHM; and B‐cell development (P = 0.026; ratio 0.085), containing PTPRC, IL7R and IGHM (Figure 5; Table S3).
Figure 5.

Ingenuity pathway analysis shows three canonical pathways of the differentially expressed genes.
Disease and Biological Function Enrichment Analysis
Ingenuity pathway analysis has been used to study potential links with biological findings and diseases. As shown in Table S4, the top biological functions were associated with endocrine system disorders, gastrointestinal disease, metabolic disease, organismal injury and abnormalities. We also compared the DEGs between DN and other disease gene sets to detect any possible correlation between DN and other diseases at the genomic level. As shown, DN was highly associated with diabetes mellitus (P = 4.4E‐20, 38 molecules), glucose metabolism disorder (P = 5.75E‐20, 41 molecules), cell movement of blood cells (P = 3.11E‐19, 34 molecules), activation of blood cells (P = 4.38E‐19, 31 molecules) and leukocyte migration (P = 2.19E‐18, 33 molecules).
Gene Networks
Ingenuity pathway analysis identified nine gene networks, with scores ranging from 2 to 33, of which the top six (score >20) were associated with: (i) network 1: cell‐to‐cell signaling and interaction, hematological system development and function, and cellular development (score = 33; Figure 6a); (ii) network 2: cellular development, cellular growth and proliferation, and hematological system development and function (score = 31; Figure 6b); (iii) network 3: cardiovascular system development and function, organismal development, and cellular movement (score = 28; Figure 6c); (iv) network 4: cell death and survival, skeletal and muscular disorders, and cell signaling (score = 28; (Figure 6d); (v) network 5: hematological system development and function, cellular function and maintenance, and cell‐to‐cell signaling and interaction (score = 24; Figure 6e); and (vi) network 6: neurological disease, organismal injury and abnormalities, and developmental disorder (score = 24; Figure 6f).
Figure 6.
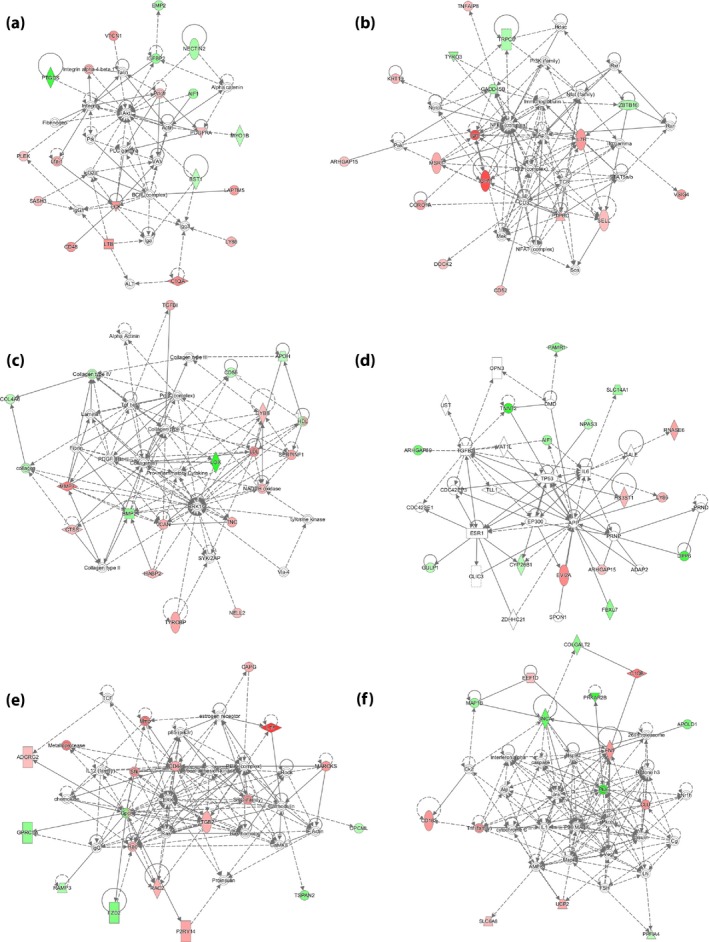
Genes forming the top six gene networks, as identified by ingenuity pathway analysis (score >20).
Regulator Network Analysis
Figure 7 shows the number of focus genes in the network relative to the IPA “Global Molecular Network.” IPA identified five regulator networks. Networks 4 and 5 identified the key upstream regulator ETS1, and showed a small number of genes involved in the quantity of lymphatic system cells, which included CD44, EEF1D, IL7R, ITGB2, LCK, LTB and SELL (Figure 7d), and tyrosine phosphorylation of protein, which includes CD44, FN1, ITGB2, LCK and SELL (Figure 7e). ETS1, an upstream regulator, is also evident in network 1 in Figure 7a and network 2 in Figure 7b.
Figure 7.
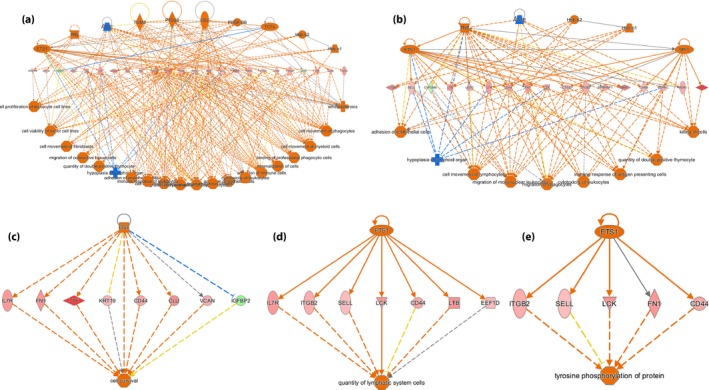
Regulatory network analysis using analysis. (a‐e) Regulatory networks generated in IPA for genes that were differentially expressed. Orange represents an activated upstream regulator or biological process; blue represents an inhibited upstream regulator or biological process; red indicates that gene expression is upregulated; green indicates that gene expression is downregulated.
Upstream Regulator Analysis
Potential upstream regulators of proteins could be identified by upstream regulator analysis. Statistically significant enrichment of upstream regulators that were included in the regulator network analysis was carried out for DN using IPA (Table S5). For DN, positive upstream regulators included TNF, ETS1, Hbb‐b2, Hbb‐b1, CD2, EGF, SPI1, TCF4, PDGF, BB, PRL and TGM2. Interestingly, the only negative upstream regulator was APOE. ETS1, SPI1 and TCF4 were three transcription regulators among the 13 upstream regulators. ETS1, which had the highest activation z‐score, was selected for future analysis.
Use of db/db Mice and db/m Mice for Verification
The db/db mouse with the BKS background comprises a type 2 diabetes model and has been shown to develop diabetic renal injury10. At 26 weeks‐of‐age, the bodyweight and blood glucose level were increased remarkably in db/db mice compared with db/m mice (Figure 8a,b). The 24‐h urinary albumin and kidney weight of the db/db mice were also significantly higher than those of the db/m mice (Figure 8c,d). We used db/db mice to verify the DEGs (Itgb2, Cd44, Sell, Fn1, Tgfbi, Il7r, Igfbp2 and Cd55) and db/m mice as a control. The results showed that compared with the db/m group, the messenger RNA expression levels of Itgb2, Cd44, Sell, Fn1, Tgfbi and Il7r were significantly upregulated. Additionally, the significantly reduced expression levels of Igfbp2 and Cd55 were also validated in the db/db mice versus the db/m mice (Figure 8e).
Figure 8.
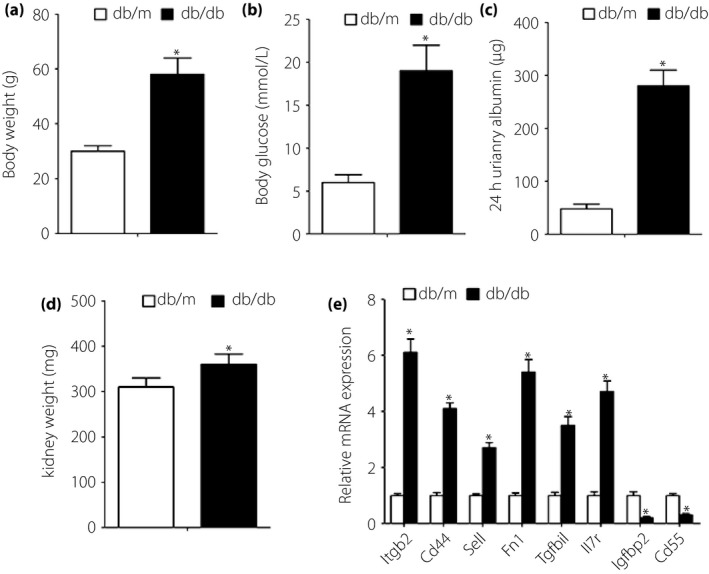
db/db and db/m mouse‐based verification of microarray data analysis. (a) Bodyweight, (b) blood glucose level, (c) 24‐h urinary albumin and (d) kidney weight were measured in 26‐week‐old mice. (e) Quantitative polymerase chain reaction results showed that compared with db/m mice, the messenger ribonucleic acid (mRNA) expression levels of Igfbp2 and Cd55 were significantly decreased, and the mRNA expression levels of Itgb2, Cd44, Sell, Fn1, Tgfbi and Il7r were significantly increased in db/db mice. *P < 0.05 versus db/m; n = 8 per group.
Identification of ITGB2 as the Direct Target Gene of Transcription Factor ETS1
Multiple transcription factors are activated under diabetic conditions in DN. Regulator network analysis showed that networks 4 and 5 identified the key upstream regulator ETS1. At the same time, ETS1 had the highest activation z‐score in the upstream regulator analysis. We also used the TRRUST (transcriptional regulatory relationships unraveled by sentence‐based text‐mining, http://www.grnpedia.org/trrust) database to analyze the target genes of ETS1 in humans and mice. ITGB2, IL7R and SELL were the common genes between the IPA upstream analysis and TRRUST database. ITGB2, an upregulated gene of DEGs, was included in the CAMs pathway and had functions in cell adhesion, and in cell surface and extracellular matrix organization. Therefore, we selected ETS1 and ITGB2 for future analysis.
To examine the roles of ETS1 and ITGB2 in DN, we used db/db mice for validation in vivo. Western blot analysis showed increased expression levels of ETS1 and ITGB2 in the db/db mice (Figure 9a). We evaluated ETS1 expression in high glucose (HG)‐treated RMCs in vitro. After 48 h of incubation in HG medium, the protein levels of ETS1 and ITGB2 were markedly increased compared with the normal glucose medium and mannitol medium groups. We next examined whether the glucose‐induced modulation of ETS1 activity was accompanied by changes in ITGB2 expression in HG medium. We used ETS1 siRNA to knock down its protein level. The expression of ETS1 in the siRNA group was significantly lower than that of the HG and siRNA‐con groups (P < 0.05). Additionally, the siRNA inhibition of ETS1 significantly reduced the activation of ITGB2 protein (P < 0.05; Figure 9b) compared with the HG alone and siRNA‐con groups. We also used ITGB2 siRNA to knock down the protein expression of ITGB2 in RMCs. The expression of ITGB2 was significantly lower in the siRNA‐ITGB2 group than in the HG alone and siRNA‐con groups (P < 0.05). However, the siRNA inhibition of ITGB2 did not reduce the expression of ETS1 protein (P < 0.05; Figure 9c) in the siRNA‐ITGB2 group.
Figure 9.
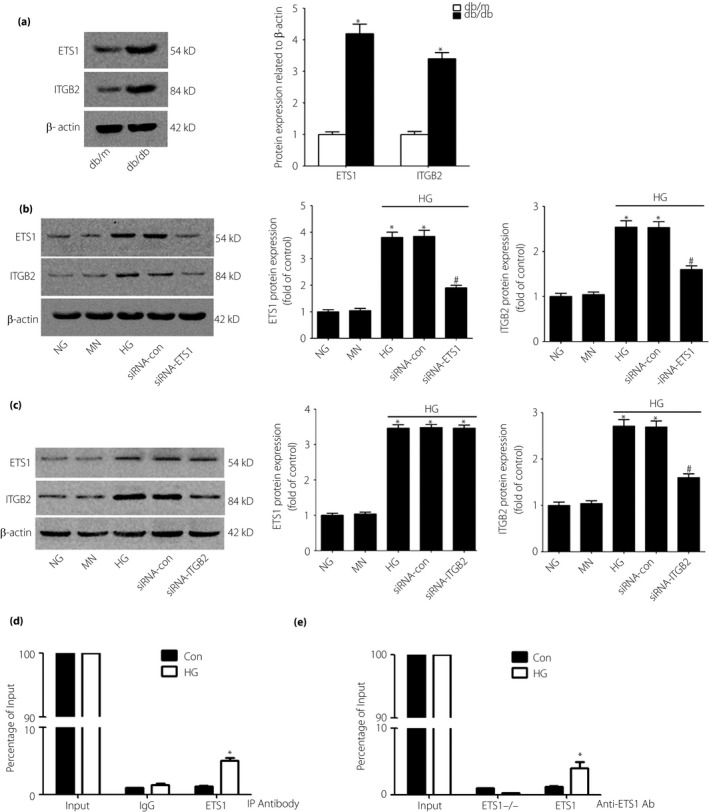
Western blot analysis of the protein levels of E26 transformation‐specific‐1 (ETS1) and integrin subunit beta 2 (ITGB2) in db/db or db/m mice and cultured rat mesangial cells after 48 h of incubation. (a) Western blot analysis shows increased protein expression of ETS1 and ITGB2 in db/db mice. (b,c) Incubation with high‐glucose (HG) medium increased the protein levels of ETS1 and ITGB2 compared with incubation with normal‐glucose (NG) medium or mannitol control (MN) medium. The expression levels of ETS1 and ITGB2 were also detected by western blotting after inhibition of ETS1 and ITGB2 by small interfering ribonucleic acid (siRNA). Data are the mean ± standard deviation of every experiment. *P < 0.05 compared with NG or MN; # P < 0.05 compared with HG or siRNA‐con (control siRNA). (d,e) Exposure to high glucose increased the binding of ETS1 to the promoter region of Itgb2. Rat mesangial cells were cultured with HG or 24.5 mmol/L mannitol + normal glucose (control [Con]) (d) without ETS1‐siRNA or (e) with ETS1‐siRNA to knock down ETS1, and proteins were extracted for chromatin immunoprecipitation assay analysis (n = 3, *P < 0.05 vs control).
To identify whether ITGB2 was the direct target gene of ETS1, we treated RMCs with 30 mmol/L glucose (HG) or 24.5 mmol/L mannitol+5.5 mmol/L glucose as the control for 48 h. We also used ETS1 siRNA to knock down the expression of ETS1 in RMCs. Using a ChIP assay followed by qPCR, we tested binding of ETS1 to the promoter regions of ITGB2‐specific genes in response to HG treatment. Compared with the control cells, ETS1 binding to the putative ETS1‐binding sites in the ITGB2 promoter was significantly increased in HG‐treated RMCs (Figure 9d). In contrast, this finding was not observed in the HG‐treated RMCs isolated from ETS1 knockdown cells (Figure 9e). These findings suggest that ETS1 likely mediates the HG‐induced expression of ITGB2‐specific genes.
Discussion
DN is emerging as the primary cause of end‐stage renal disease worldwide11. In the present research, we identify shared pathways and networks of transcriptional dysregulation in the kidney glomeruli of DN by carrying out an unbiased transcriptome comparison of glomerular gene expression in human and mouse models of DN. Signaling pathway enrichment analysis showed that CAMs and the ECM–receptor interaction are the two major pathways in the extracellular matrix category in DN. CAMs are expressed on the cell surface, and mediate cell–cell binding and cell‐extracellular matrix adhesion, recognition, activation and migration12. There is evidence that adhesion molecules are important in the development of DN13. ITGB2, an upregulated gene among the DEGs, is involved in the CAM pathway and has functions in cell adhesion, and in cell surface and extracellular matrix organization. ITGB2 is a protein‐coding gene. ITGB2 is the beta subunit of four different structures: LFA‐1 (CD11a), macrophage‐1 antigen (CD11b), integrin alphaXbeta2 (CD11c) and integrin alphaDbeta2 (CD11d). CD11b, a component of the beta2‐integrin adhesion molecule Mac‐1 that is expressed on neutrophils, closely relates to neutrophil adhesion. This could result in more neutrophil adherence in DN at the activated sites and provide a focus for platelet aggregation. Mac‐1 blockade in a model of lung injury can reduce neutrophil accumulation and inflammatory damage, even after the injury begins14. These results indicate that an increase in cellular adhesion and the production of CAMs might lead to accelerated small vessel lesions, a process typical of DN.
Canonical pathway analysis showed that the top differentially regulated pathway in DN was the complement system. The transcript levels of the C3 complement component were increased in human DN glomeruli. The deposition of C3 in glomeruli and glomerular capillaries has been observed in KK mice, a model of type 2 diabetes mellitus15. Clinical studies have shown a sixfold increase in the glomerular levels of C3 in kidney biopsy samples from patients with overt diabetic kidney disease3. These results suggested that the complement system might play a functional role in DN and glomerulosclerosis.
To validate the accuracy of the DEGs identified by microarray data analysis, we used db/db mice and db/m mice for verification. We selected several genes closely related to the pathogenesis of DN for further verification by qPCR, including ITGB2, SELL, CD44, FN1, TGFBI, IL7R, IGFBP2 and CD55. CD44 and FN1 are involved in ECM–receptor interactions. SELL and ITGB2 are involved in the CAM pathway. TGFBI encodes a protein that is induced by TGFβ, plays a role in cell–collagen interactions and can be found in the gene network. IL7R is a molecule that is involved in both primary immune deficiency signaling and the B‐cell development pathway. IGFBP2 and CD55 were significantly downregulated genes among the DEGs. Furthermore, CD44, ITGB2, SELL, IL7R and FN1 had the same upstream components as transcription factor ETS1. The regulation trends of those genes were similar between the microarray and qPCR data.
Gene regulatory networks can be regarded as essential to the understanding of some diseases and might also lead to new therapeutic approaches. The present investigation showed that ETS1 could be detected in regulatory networks 1, 2, 4 and 5. Additionally, ETS1 had the highest activation z‐score in the upstream analysis. ETS1 is a member of the ETS family of transcription factors, and has functions in tumor invasion and metastasis16, 17. ETS1 regulates various types of genes, and plays roles in stem cell development, tumorigenesis and cell senescence or death. The multifunctional cytokine, TGFβ, has been implicated as a principal mediator of diabetic kidney disease18, 19 and induces ETS1 expression20. ETS1 is crucial for kidney development, glomeruli integrity and matrix metalloproteinase expression21. Liu et al.22 showed that ETS1 expression can be associated with DN progression. Decreased ETS1 expression and increased TIMP‐2 expression might play an important role in the progression of glomerulosclerosis and renal interstitial fibrosis in DN.22 Expression of ETS1 in the kidney is closely related to matrix remodeling in DN. Therefore, we suspect that ETS1 plays a role in matrix remodeling by regulating matrix‐degrading enzymes.
Renal expression of the ETS1 proto oncogene is closely related to matrix remodeling in DN. We further investigated the potential mechanism of ETS1 in HG‐treated RMCs. ETS1 is a transcription factor23. Previous studies have shown that HG treatment can increase the nuclear accumulation of ETS1 protein in podocytes. Additionally, blocking the ERK pathway can suppress the nuclear accumulation of ETS1 in podocytes24. The upstream regulator analysis showed that ETS1 is the upstream regulator of ITGB2. We further examined the relationship between ETS1 and ITGB2. In vivo, the ETS1 and ITGB2 levels are significantly increased in diabetic mice. In vitro, we showed that HG treatment upregulates the expression levels of ETS1 and ITGB2. Furthermore, inhibiting ETS1 significantly reduces the HG‐induced expression of ITGB2, but inhibiting ITGB2 does not reduce the protein expression of ETS1 in HG‐induced mesangial cells. This suggests that ETS1 plays a crucial role in the process. Our upstream regulator analysis shows that the ETS1 transcription regulator is the upstream regulator of ITGB2. According to the ChIP‐qPCR analysis, ETS1 binding to the promoter regions of ITGB2 was increased in HG‐treated renal mesangial cells. We conclude that HG stimulates the expression of ETS1 and ITGB2 through the binding of ETS1 directly to the promoter of ITGB2. These findings might indicate that ETS1 is a novel transcriptional regulator in DN.
In summary, the present data provide a comprehensive bioinformatics analysis of DEGs that might be related to the progression of DN. We have identified 89 candidate DEGs with multiple cohort profile datasets and integrated bioinformatics analyses. A variety of new genes and pathways might be involved in the pathogenesis of DN. We also conclude that ETS1 binding to the promoter regions of ITGB2 is increased in HG‐treated RMCs. These findings could lead to a significant increase in our understanding of the etiology and underlying molecular events of DN.
Disclosure
The authors declare no conflict of interest.
Supporting information
Table S1 ¦ Primer sequences used in real‐time polymerase chain reaction.
Table S2 ¦ Signaling pathway enrichment analysis of differentially expressed gene function in diabetic nephropathy.
Table S3 ¦ Three canonical pathways identified by ingenuity pathway analysis.
Table S4 ¦ Top 10 biological functions and diseases identified through ingenuity pathway analysis.
Table S5 ¦ Upstream regulators identified through ingenuity pathway analysis.
Acknowledgments
This research was supported by grants from the National Natural Science Foundation of China (No. 81470949, 81700629, 81870491) and the Major State Basic Research Development Program of China (No. 2014CBA02005). Microarray data were analyzed by Beijing Computing Center (Beijing, China).
J Diabetes Investig 2019; 10: 972–984
References
- 1. Susztak K, Böttinger E, Novetsky A, et al Molecular profiling of diabetic mouse kidney reveals novel genes linked to glomerular disease. Diabetes 2004; 53: 784. [DOI] [PubMed] [Google Scholar]
- 2. Wilson KH, Eckenrode SE, Li QZ, et al Microarray analysis of gene expression in the kidneys of new‐ and post‐onset diabetic NOD mice. Diabetes 2003; 52: 2151–2159. [DOI] [PubMed] [Google Scholar]
- 3. Woroniecka KI, Park ASD, Mohtat D, et al Transcriptome analysis of human diabetic kidney disease. Diabetes 2011; 60: 2354. [DOI] [PMC free article] [PubMed] [Google Scholar]
- 4. Hodgin JB, Nair V, Zhang H, et al Identification of cross‐species shared transcriptional networks of diabetic nephropathy in human and mouse glomeruli. Diabetes 2013; 62: 299–308. [DOI] [PMC free article] [PubMed] [Google Scholar]
- 5. Mi H, Dong Q, Muruganujan A, et al PANTHER version 7: improved phylogenetic trees, orthologs and collaboration with the Gene Ontology Consortium. Nucleic Acids Res 2010; 38: D204–D210. [DOI] [PMC free article] [PubMed] [Google Scholar]
- 6. Ashburner M, Ball CA, Blake JA, et al Gene Ontology: tool for the unification of biology. The Gene Ontology Consortium. Nat Genet 2000; 25: 25–29. [DOI] [PMC free article] [PubMed] [Google Scholar]
- 7. Gene Ontology Consortium . Gene Ontology Consortium: going forward. Nucleic Acids Res 2015; 43: 1049–1056. [DOI] [PMC free article] [PubMed] [Google Scholar]
- 8. Puff R, Dames P, Weise M, et al Reduced proliferation and a high apoptotic frequency of pancreatic beta cells contribute to genetically‐determined diabetes susceptibility of db/db BKS mice. Horm Metab Res 2011; 43: 306–311. [DOI] [PubMed] [Google Scholar]
- 9. Lebrec JJ, Huizinga TW, Toes RE, et al Integration of gene ontology pathways with North American Rheumatoid Arthritis Consortium genome‐wide association data via linear modeling. BMC Proc 2009; 3: S94. [DOI] [PMC free article] [PubMed] [Google Scholar]
- 10. Gurley SB, Clare SE, Snow KP, et al Impact of genetic background on nephropathy in diabetic mice. Am J Physiol Renal 2006; 290: F214. [DOI] [PubMed] [Google Scholar]
- 11. Mason RM, Wahab NA. Extracellular matrix metabolism in diabetic nephropathy. J Am Soc Nephrol 2003; 14: 1358. [DOI] [PubMed] [Google Scholar]
- 12. Shikata K, Makino H. Microinflammation in the pathogenesis of diabetic nephropathy. J Diabetes Investig 2013; 4: 142–149. [DOI] [PMC free article] [PubMed] [Google Scholar]
- 13. Goldberg RB. Cytokine and cytokine‐like inflammation markers, endothelial dysfunction, and imbalanced coagulation in development of diabetes and its complications. J Clin Endocrinol Metab 2009; 94: 3171–3182. [DOI] [PubMed] [Google Scholar]
- 14. Fardon NJ, Wilkinson R, Thomas TH. Abnormalities in primary granule exocytosis in neutrophils from Type I diabetic patients with nephropathy. Clin Sci 2002; 102: 69. [PubMed] [Google Scholar]
- 15. Wehner H, Höhn D, Faix‐Schade U, et al Glomerular changes in mice with spontaneous hereditary diabetes. Lab Invest 1972; 27: 331. [PubMed] [Google Scholar]
- 16. Sato Y, Kanno S, Oda N, et al Properties of two VEGF receptors, Flt‐1 and KDR, in signal transduction. Ann N Y Acad Sci 2000; 902: 201–207. [DOI] [PubMed] [Google Scholar]
- 17. Oda N, Abe M, Sato Y. ETS‐1 converts endothelial cells to the angiogenic phenotype by inducing the expression of matrix metalloproteinases and integrin β 3. J Cell Physiol 1999; 178: 121–132. [DOI] [PubMed] [Google Scholar]
- 18. Border WA, Okuda S, Languino LR, et al Transforming growth factor‐beta regulates production of proteoglycans by mesangial cells. Kidney Int 1990; 37: 689–695. [DOI] [PubMed] [Google Scholar]
- 19. Sharma K, Ziyadeh FN. Hyperglycemia and diabetic kidney disease. The case for transforming growth factor‐beta as a key mediator. Diabetes 1995; 44: 1139–1146. [DOI] [PubMed] [Google Scholar]
- 20. Liu S, Liang Y, Huang H, et al ERK‐dependent signaling pathway and transcriptional factor Ets‐1 regulate matrix metalloproteinase‐9 production in transforming growth factor‐beta1 stimulated glomerular podocytes. Cell Physiol Biochem 2005; 16: 207–216. [DOI] [PubMed] [Google Scholar]
- 21. Razzaque MS, Naito T, Taguchi T. Proto‐oncogene ets‐1 and the kidney. Nephron 2001; 89: 1–4. [DOI] [PubMed] [Google Scholar]
- 22. Liu DX, Liu XM, Su Y, et al Renal expression of proto‐oncogene Ets‐1 on matrix remodeling in experimental diabetic nephropathy. Acta Histochem 2011; 113: 527–533. [DOI] [PubMed] [Google Scholar]
- 23. Sharrocks AD. The ETS‐domain transcription factor family. Nat Rev Mol Cell Biol 2001; 2: 827–837. [DOI] [PubMed] [Google Scholar]
- 24. Bai Y, Wang L, Li Y, et al High ambient glucose levels modulates the production of MMP‐9 and alpha5(IV) collagen by cultured podocytes. Cell Physiol Biochem 2006; 17: 57–68. [DOI] [PubMed] [Google Scholar]
Associated Data
This section collects any data citations, data availability statements, or supplementary materials included in this article.
Supplementary Materials
Table S1 ¦ Primer sequences used in real‐time polymerase chain reaction.
Table S2 ¦ Signaling pathway enrichment analysis of differentially expressed gene function in diabetic nephropathy.
Table S3 ¦ Three canonical pathways identified by ingenuity pathway analysis.
Table S4 ¦ Top 10 biological functions and diseases identified through ingenuity pathway analysis.
Table S5 ¦ Upstream regulators identified through ingenuity pathway analysis.


