Figure 5.
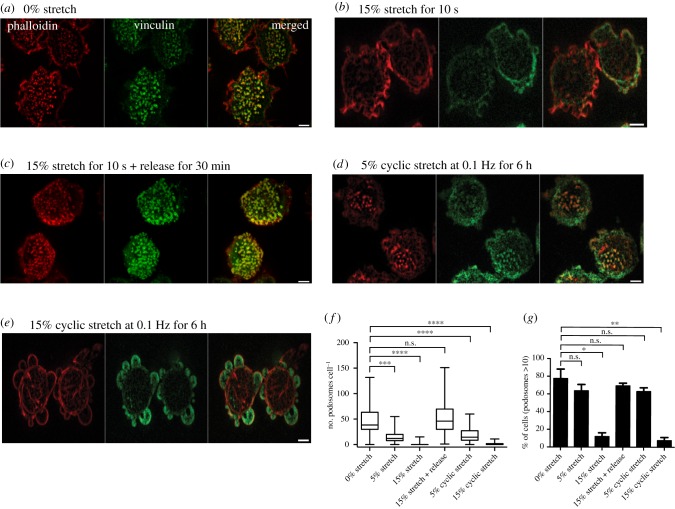
Stretching of substrate-induced podosome disassembly. (a–e) Representative images of cells on PDMS substrate coated with fibronectin fixed and stained after substrate radial stretching or release. Actin was labelled with phalloidin (left, red), vinculin was visualized by antibody staining (middle, green) and their merged image is shown in the right panel. (a) Cells on non-stretched substrate. (b) Cells subjected to 15% stretching for 10 s. (c) Cells stretched for 10 s and incubated for 30 min following the stretch release. (d,e) Cells subjected to cyclic stretching of (d) 5% and (e) 15% magnitude at 0.1 Hz for 6 h. Scale bars, 5 µm. (f,g) Quantification of (f) the number of podosomes per cell (box-and-whiskers plots), and (g) percentage of cells containing more than 10 podosomes (mean ± s.d.) for all experimental situations shown in (a–e), as well as for 5% single stretch for 10 s. Graphs represent results of two to three independent experiments. The significance of the difference between groups was estimated by the two-tailed Student's t-test, the range of p-values > 0.05(non-significant), lesser than or equal to 0.05, lesser than or equal to 0.01, lesser than or equal to 0.001 and lesser than or equal to 0.0001 are denoted by ‘n.s.’, one, two, three and four asterisks (*), respectively. All images were taken using spinning-disc confocal microscopy.

