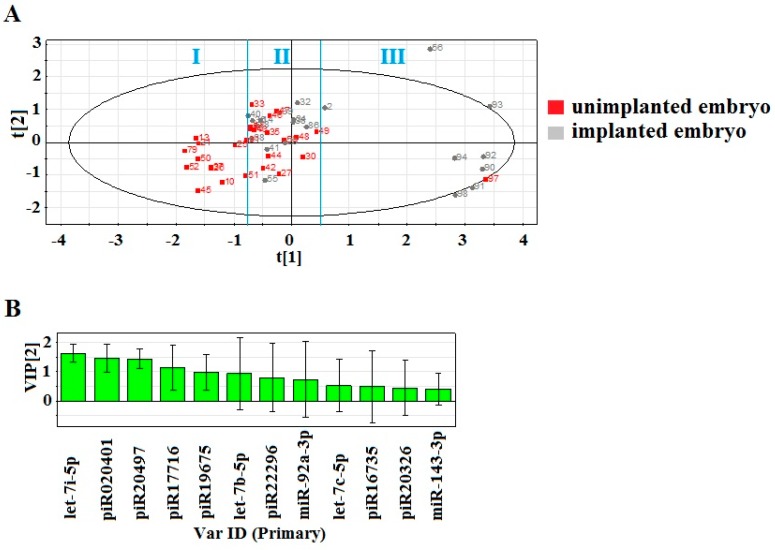
Figure 5.
Partial least squares discriminant analysis (PLS-DA) of 2−ΔΔCt RT-PCR data on the expression of sncRNAs in the 48-embryo culture medium samples. Arabic numerals denote the sample number. Roman numerals (I, II, III) denote the cluster of samples depending on the result of embryo transfer into the uterine cavity and the profile of RNA expression in the cultivation medium. (A) score plot with the imposition of information of the sncRNA expression level on the results of embryo transfer into the uterine cavity, (B) Variable Importance in Projection (VIP) score.

