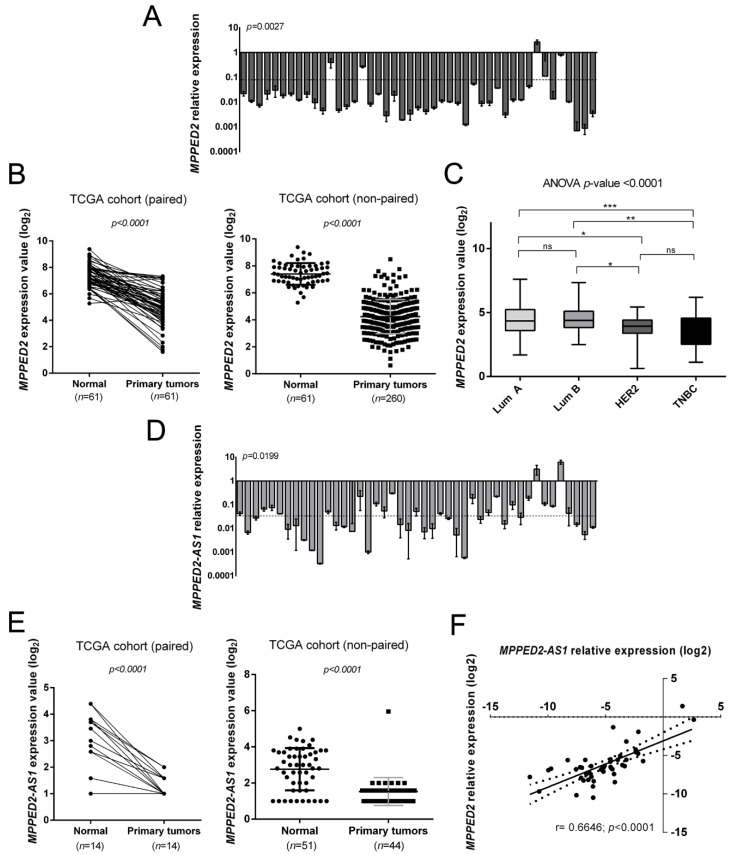
Figure 1.
Expression of MPPED2 and MPPED2-AS1 in human breast carcinoma tissues. (A) MPPED2 expression levels were evaluated by quantitative real-time polymerase chain reaction (qRT-PCR) in 45 breast carcinoma tissues. The dashed line represents the average relative expression value of the analyzed samples (p = 0.0027). Data are reported as 2−ΔΔCt values ± standard deviation (SD), compared to the mean of breast normal tissues, set equal to 1. (B) MPPED2 expression levels were evaluated in a dataset available in The Cancer Genome Atlas (TCGA). Paired (left panel) and non-paired (right panel) breast cancer samples were analyzed. t-test: ****, p < 0.0001 (primary tumors vs. normal tissues in both paired and non-paired samples). (C) MPPED2 expression levels were evaluated in the molecular subtypes of breast carcinoma tissues (Lum A, Lum B, HER2 and TNBC) in the TCGA dataset. Box and whiskers: Min to max. One-way analysis of variance (ANOVA) test: ****, p < 0.0001. (D) MPPED2-AS1 levels were evaluated in 45 breast carcinoma tissues by qRT-PCR. The dashed line represents the average relative expression value of the analyzed samples (p = 0.0199). Data are reported as 2−ΔΔCt values ± SD, compared to the mean of breast normal tissues, set equal to 1. (E) MPPED2-AS1 expression levels were evaluated in the TCGA dataset. Paired (left panel) and non-paired (right panel) breast cancer samples were evaluated and only samples in which MPPED2-AS1 was detectable were considered for the analysis. t-test: ****, p < 0.0001 (primary tumors vs. normal tissues in both paired and non-paired samples). (F) Correlation scatter plot (Spearman’s Rank) between qRT-PCR levels of MPPED2 and MPPED2-AS1 analyzed in 45 breast carcinoma samples (r = 0.6646; ****, p < 0.0001).

