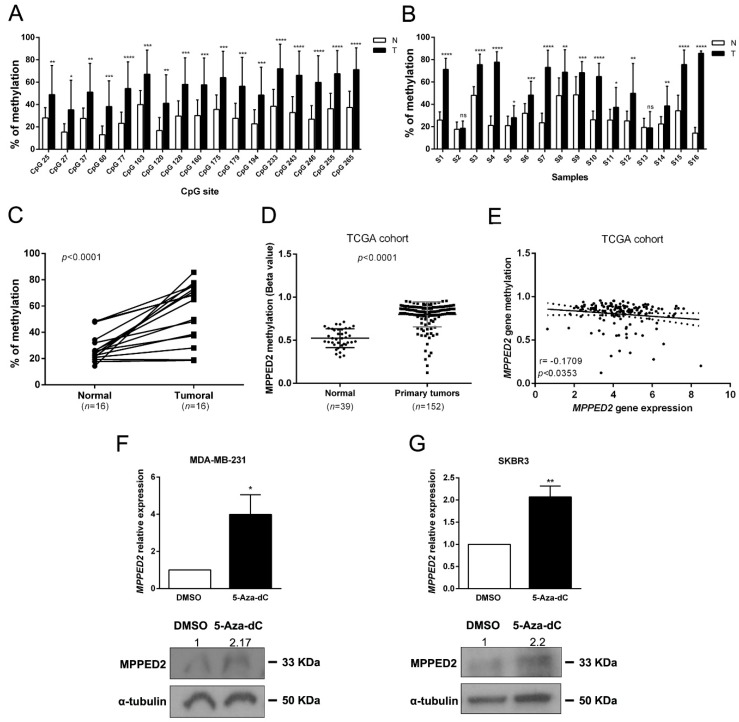
Figure 3.
MPPED2 methylation status in normal and tumoral samples. (A) Methylation levels of CpG sites in the MPPED2 promoter. Each histogram represents the mean value of each CpG site in the whole cohort analyzed. White and black bars represent normal and breast cancer tissues, respectively. t-test: *, p < 0.05; **, p < 0.01; ***, p < 0.001; ****, p < 0.0001. (B) Methylation levels of the MPPED2 promoter in each sample. Histograms represent the mean methylation value of all CpG sites in each sample. White and black bars represent normal and breast cancer tissues, respectively (S1–S16, different patient samples). t-test: *, p < 0.05; **, p < 0.01; ***, p < 0.001; ****, p < 0.0001; ns, not significant. (C) Percentage of methylation of each tumoral sample compared to matched normal sample. t-test: ****, p < 0.0001. (D) MPPED2 methylation levels were evaluated in a dataset available at The Cancer Genome Atlas (TCGA) comprising 152 primary breast tumors and 39 normal breast samples. t-test: ****, p < 0.0001. (E) Correlation scatter plot (Spearman’s Rank) analysis between MPPED2 methylation values and expression levels in the TCGA cohort (r = −0.1709; p < 0.0353). (F,G) MPPED2 expression levels were evaluated by qRT-PCR (upper panel) in MDA-MB-231 and SKBR3 cell lines after 2 µM 5-Aza-dC or dimethyl sulfoxide (DMSO) treatment for 120 h. Data were reported as mean ± SD. t-test: *, p < 0.05 (5-Aza-dC vs. DMSO, MDA-MB-231); **, p < 0.01 (5-Aza-dC vs. DMSO, SKBR3). MPPED2 protein expression was also evaluated by Western blot (lower panel). Densitometric analysis of a representative experiment was performed by using ImageJ software. MPPED2 protein expression in 5-Aza-dC treatment was compared to DMSO treatment, set equal to 1. Original blots were shown in Supplementary Materials Figure S4.

