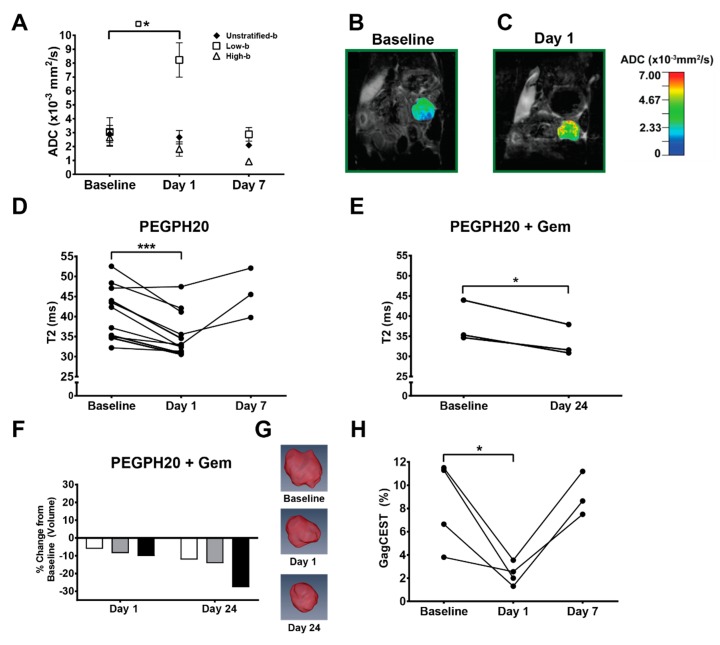
Figure 2.
Multiparametric MRI results. (A) Unstratified and stratified apparent diffusion coefficient (ADC) values at baseline (n = 4), day 1 (n = 4), and day 7 (n = 3); points = means, error bars = SEM. Low b-values = 7, 47, 81 s/mm2. High b-values = 126, 180, 234, 340, 549 s/mm2. (B,C) Representative ADC color-overlay maps on proton density weighted anatomic, coronal plane images from a KPC mouse at baseline (B) and 24 h (C) following PEGPH20 treatment. (D) T2 values for animals treated with PEGPH20 at baseline (n = 11), day 1 (n = 11), and day 7 (n = 3). (E) T2 values for animals that underwent one full 3-week cycle of PEGPH20 + gemcitabine combination therapy (n = 3). (F) Tumor volume measurements (n = 3) plotted as percent change from baseline for animals that underwent the 3-week PEGPH20 + gemcitabine regimen. (G) Three-dimensional volumetric renderings from a representative KPC animal treated with PEGPH20 + gemcitabine regimen at baseline, day 1, and day 24. (H) Glycosaminoglycan chemical exchange saturation transfer (GagCEST) values at baseline, day 1 and day 7 after PEG monotherapy (n = 3). * = p <0.05; *** = p <0.001.

