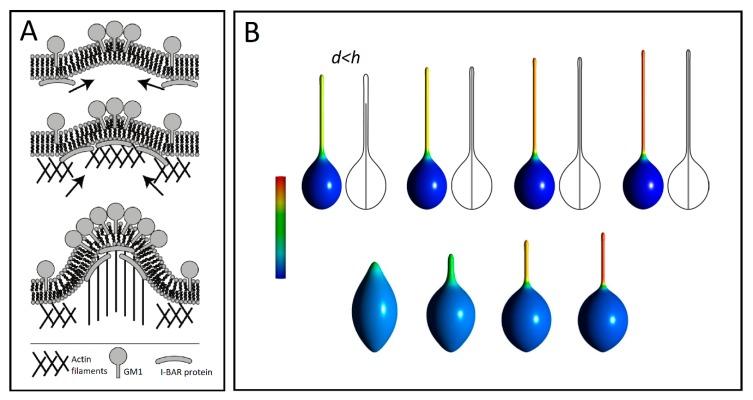
Figure 5.
(A) A schematic diagram for the recruitment of I-BAR domain proteins and actin filaments by GM1 aggregates (adapted from Reference [10]). (B) Numerically calculated equilibrium cell shapes for different lengths d of the actin rod-like structure enclosed inside the vesicle of height h. All vesicles have the same relative volume (0.9). Apart from the top-left vesicle shape, d = h. The mixing entropy term was considered only for the second row. The color represents the fraction area covered by isotropic components. The fully blue color corresponds to a membrane composed of isotropic nanodomains only, while the yellow and red colors denote high concentrations of anisotropic components (adapted from Reference [92]).

