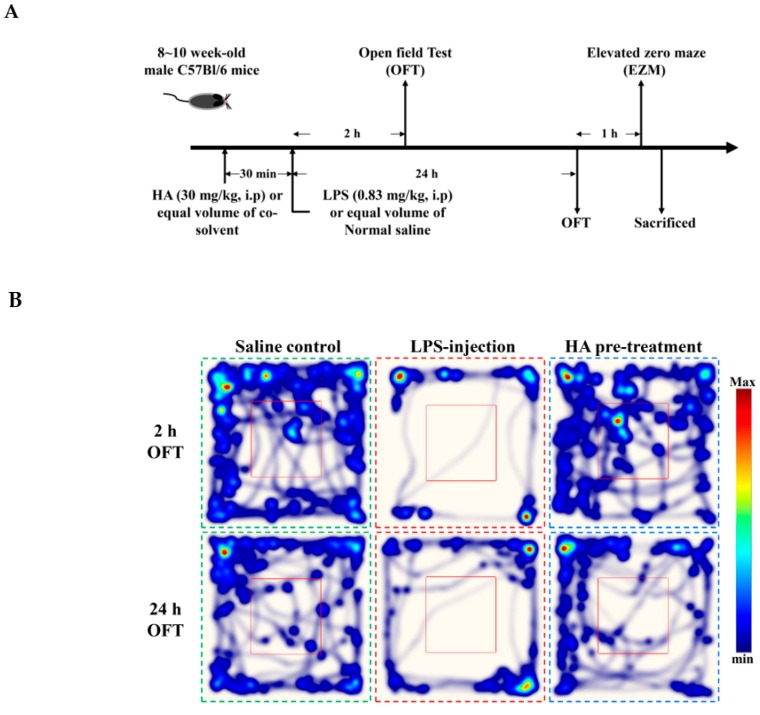
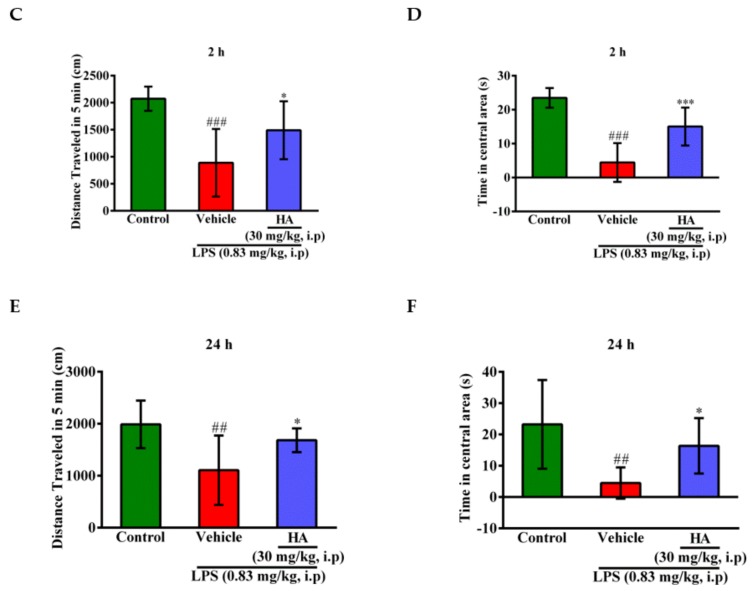
Figure 5.
Effect of HA on sickness behavior in the open field test following a systemic LPS challenge. (A) Experimental timeline and design. (B) Heat-map represented the tracks of mice in the different groups in OFT, red = more time, blue = less time. (C) Total distance traveled 5 min in the different groups administrated with sterile saline or LPS (0.83 mg/kg, i.p) for 2 h. (D) Percentage of time spent in 5 min in the open area in the different groups for 2 h. (E) Total distance traveled 5 min in the different groups challenged with sterile saline or LPS (0.83 mg/kg, i.p) for 24 h. (F) Percentage of time spent in 5 min in the central area in the different groups for 24 h. Data represent group means ± S.D., n = 7 mice/group. ## p < 0.01 and ### p < 0.001 as compared with the saline control group (Control); * p < 0.05 and *** p < 0.001 as compared with the co-solvent group (vehicle).


