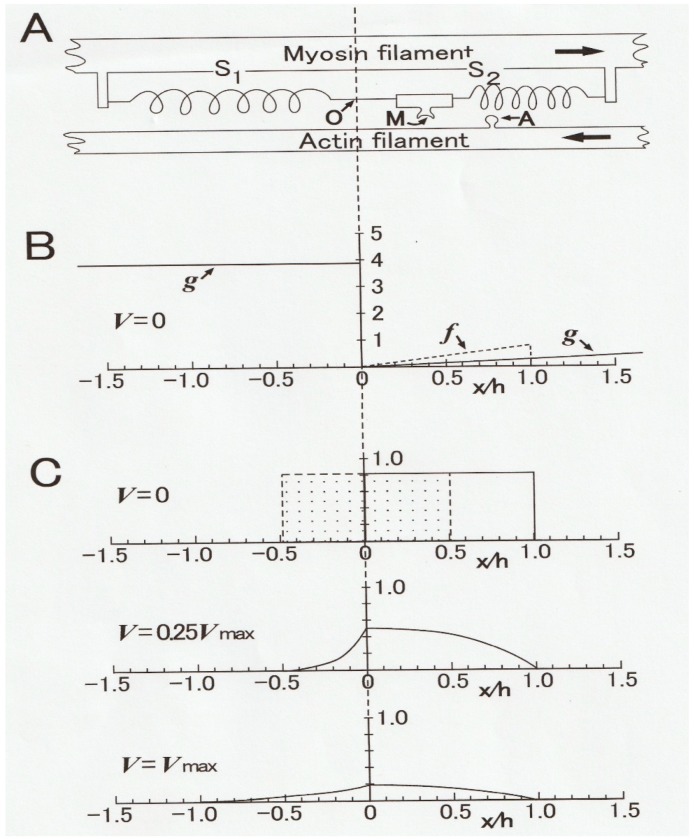
Figure 5.
Huxley contraction model, constructed to account for the P–V relation of Hill in terms of distribution of the A–M link between myosin head (M) extending from a myosin filament and corresponding myosin-binding site (A) in an actin filament. (A) Diagram showing a myosin head (M) connected to a myosin filament via springs S1 and S2, and a myosin-binding site (A) on an actin filament. Arrows indicate directions of relative sliding between actin and myosin filaments. (B) Diagram showing the rate constants (f and g) as functions of distance (x) of M from its equilibrium position (0). (C) Diagrams showing distribution of the A–M link along the x axis at V = 0 (isometric condition), at V= 0.25Vmax, and V = Vmax. For further explanation, see text. From Ref. [9].

