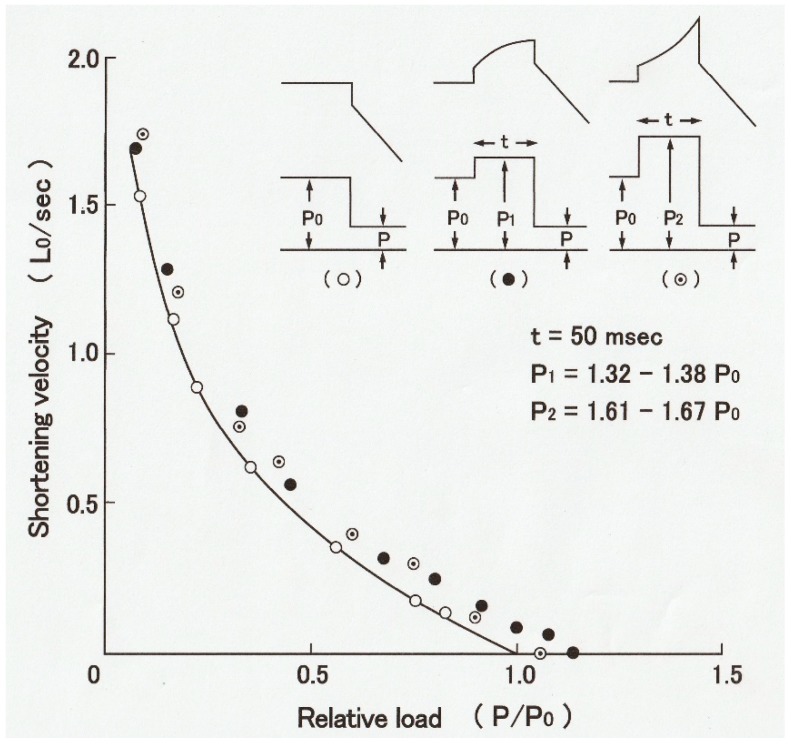
Figure 11.
Shift of the P–V relation to the right along the force (load) axis as the result of enhancement of mechanical performance in isotonically lengthening muscle fibers. Open circles and the solid line show the P–V relation, obtained in the control condition, while filled and dotted circles show data points, obtained during isotonic lengthening under a load of 1.32~1.38Po and 1.61~1.67Po, respectively. Note that the shift of the P–V curve occurs at all levels of shortening velocity. From Ref. [15].

