Figure 1.
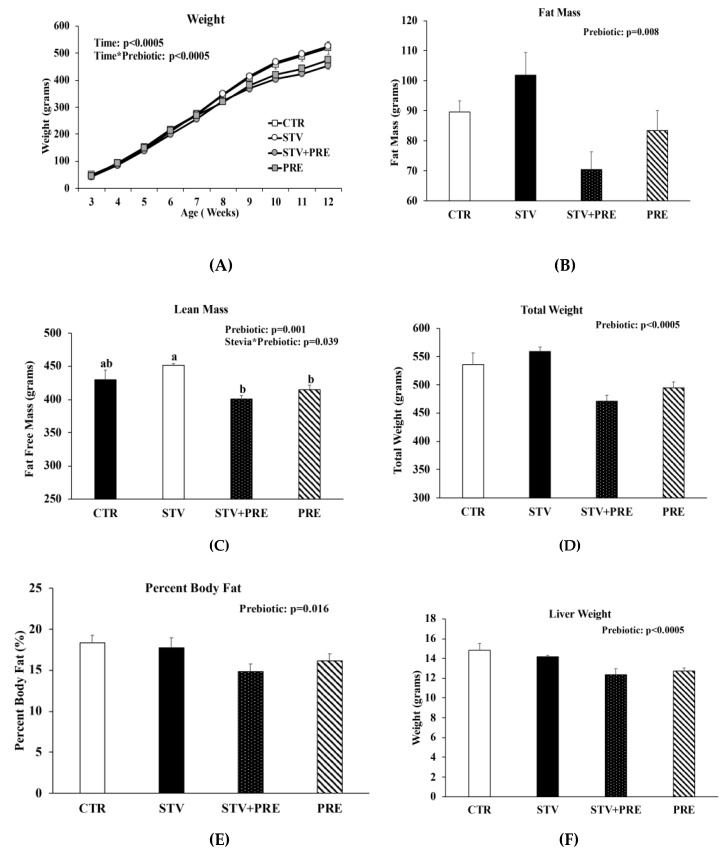
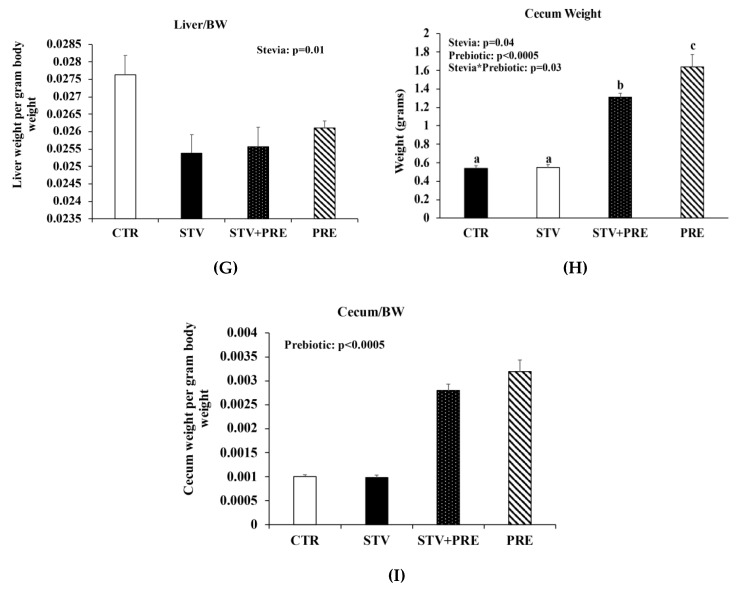
Body weight, body composition, and cecum weight in male rats consuming RebA, prebiotics, both or neither for 9 weeks. (A) Body weight; (B) fat mass; (C) lean mass; (D) final total body weight; (E) percent body fat; (F) liver weight; (G) liver weight per gram of body weight; (H) cecum weight; (I) cecum weight per gram of body weight. Panels B-I were measured at 12 weeks of age. Values are mean ± SEM, n = 8/group. Labelled means without a common superscript letter (a, b, c) differ, p < 0.05. CTR, control; STV, RebA; STV + PRE, RebA and prebiotic; PRE, prebiotic; BW, body weight.


