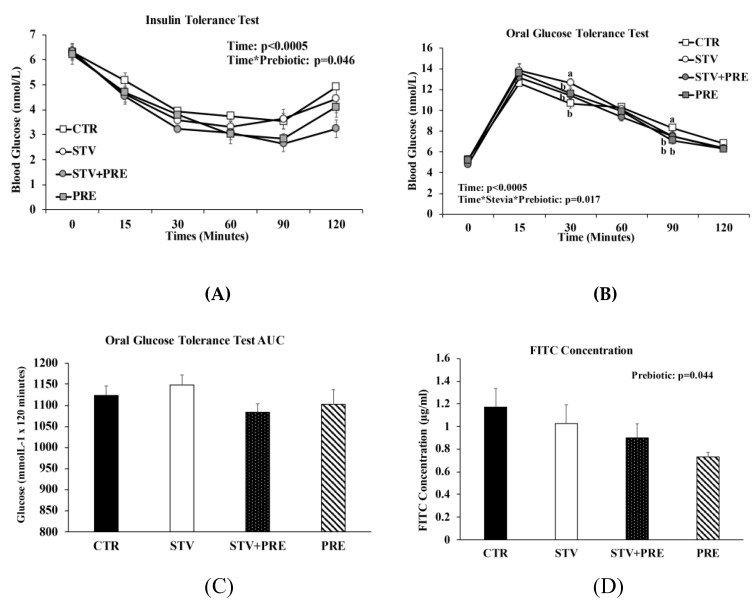
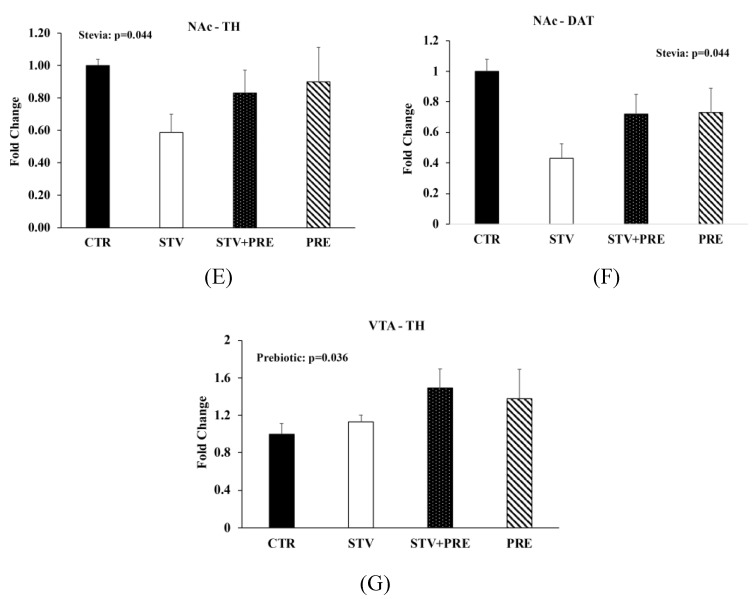
Figure 3.
Insulin and glucose tolerance tests, intestinal permeability, and gene expression in the brain of male rats consuming RebA, prebiotics, both or neither for 9 weeks. (A) Insulin tolerance test; (B) oral glucose tolerance test; (C) oral glucose tolerance test area under the curve (AUC); (D) gut permeability (FITC) test; (E) nucleus accumbens tyrosine hydroxylase mRNA levels; (F) nucleus accumbens dopamine transporter mRNA levels; (G) ventral tegmental area tyrosine hydroxylase mRNA levels. Values are mean ± SEM, n = 8/group. Labelled means without a common superscript letter (a, b, c) differ, p < 0.05. CTR, control; STV, RebA; STV + PRE, RebA and prebiotic; PRE, prebiotic; AUC, area under the curve; FITC, fluorescein isothiocyanate–dextran-4000; NAc-TH, nucleus accumbens tyrosine hydroxylase; NAc-DAT, nucleus accumbens dopamine transporter; VTA-TH, ventral tegmental area tyrosine hydroxylase.


