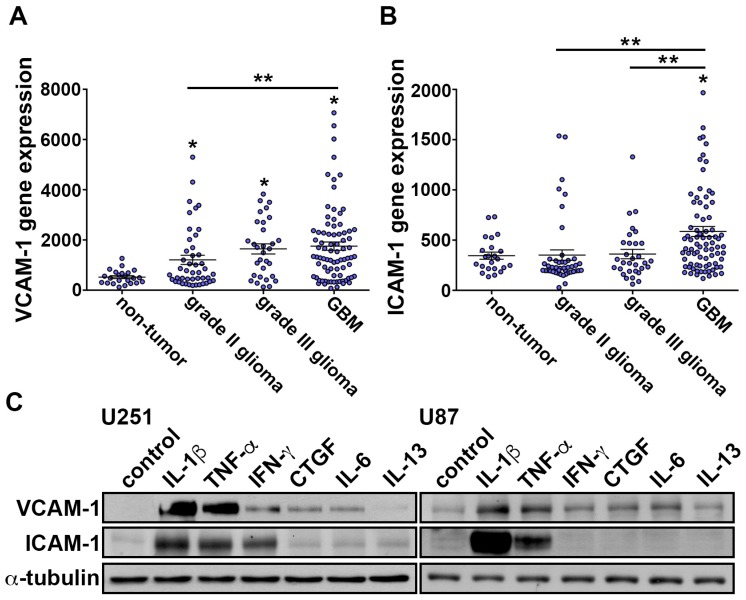
Figure 1.
VCAM-1 and ICAM-1 levels correlated with the glioma clinico-pathological grade. (A) Messenger RNA levels of VCAM-1 in specimens of glioma patients that were obtained from GSE4290 datasets. The data are presented as mean ± S.E.M * p < 0.05 compared with the non-tumor group. ** p < 0.05 grade II glioma group compared with the GBM group. (B) Messenger RNA levels of ICAM-1 in specimens from glioma patients that were obtained from GSE4290 datasets. The values are presented as mean ± S.E.M. * p < 0.05 compared with the non-tumor group. ** p < 0.05 grade II and grade III glioma group compared with the GBM group. (C) U251 and U87 cells were added with IL-1β (10 ng/mL), TNF-α (10 ng/mL), IFN-γ (50 ng/mL), CTGF (100 ng/mL), IL-6 (10 ng/mL) or IL-13 (10 ng/mL) cytokines for 24 h. The expressions levels of ICAM-1 and VCAM-1 were analyzed using western blotting.

