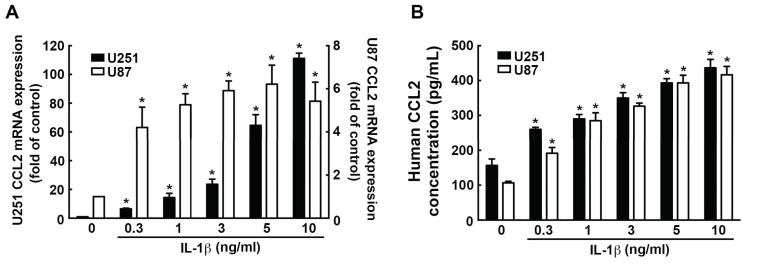
Figure 5.
Upregulation of CCL2 expression induced by IL-1β in GBM. Cells were treated with various concentrations of IL-1β (0.3, 1, 3, 5, or 10 ng/mL) for 6 h (A) or 24 h (B), and CCL2 expression was analyzed by real-time PCR (A) and ELISA (B). One-way ANOVA followed by Bonferonni multiple comparison test was used to determine the significance of the data. * p < 0.05 compared with the control group. The data are presented as mean ± S.E.M. (representative of independent experiments = 3).

