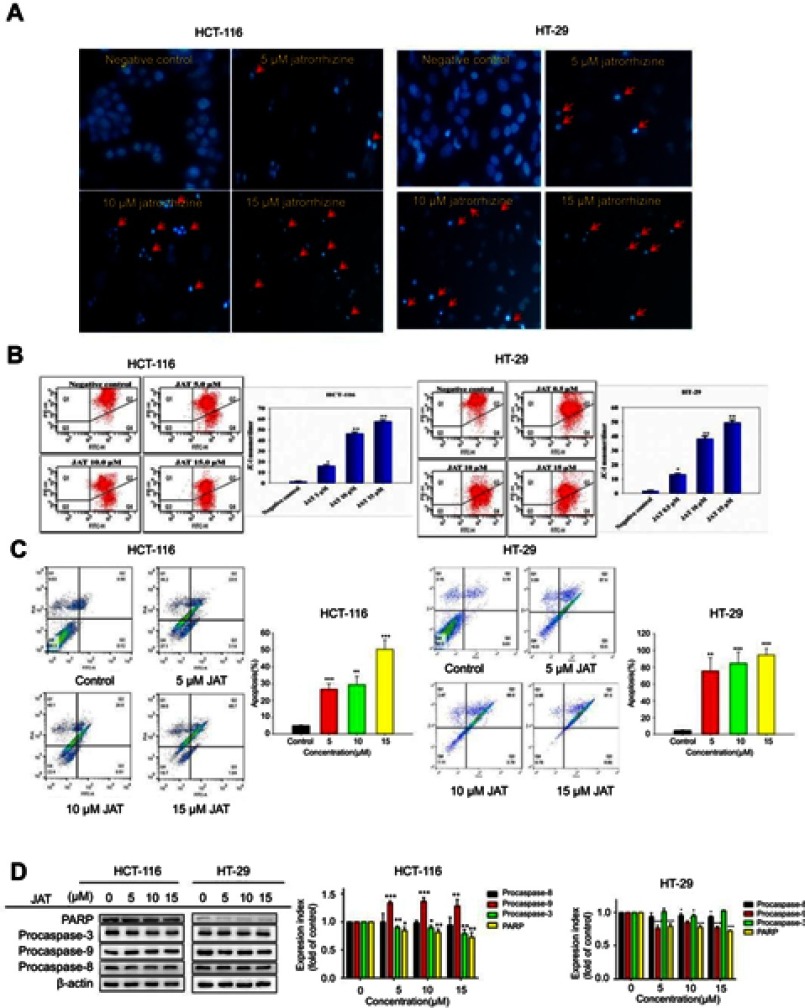
Figure 3.
JAT induced apoptosis of colon cancer cells.
Notes: (A) The morphological features of HCT-116 and HT-29 cells stained by Hoechst 33342 under fluorescence microscope, the red arrow indicated obvious apoptosis (×400). (B) Flow cytometry measured mitochondrial transmembrane potential (△Ψm) by JC-1 cationic dye of HCT-116 and HT-29 cells. Data are expressed as mean of 590 nm emission spectrum of triplicate samples for JC-1 monomer/dimer ratio. (C) The apoptosis of HCT-116 and HT-29 cells was measured by flow cytometry after treated with JAT. (D) Western blotting was used to detect the expression of apoptosis-related proteins after treatment with JAT. Density of bands was quantified with Quantity One software. All values were presented as the mean±standard deviation (SD). *P<0.05, **P<0.01, and ***P<0.001 compared with control.
Abbreviation: JAT, jatrorrhizine.

