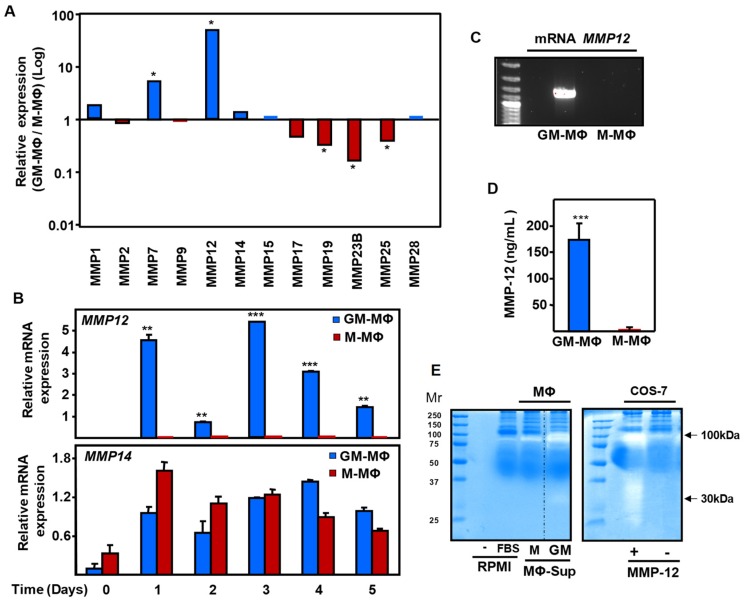
Figure 2.
Expression profile of matrix metalloproteinases (MMPs) in GM-MΦ and M-MΦ. Human monocytes were incubated with GM-CSF or M-CSF, resulting in GM-MΦ and M-MΦ, respectively. (A) The relative mRNA expression levels of different MMPs was determined by qRT-PCR and represented by the GM-MΦ/M-MΦ ratio. (B) mRNA expression levels of MMP-12 and MMP-14 along GM-MΦ and M-MΦ polarization, as determined by qRT-PCR. The statistical significance of GM-MΦ versus M-MΦ data is shown. (C) MMP-12 mRNA expression of GM-MΦ and M-MΦ analyzed by RT-PCR, followed by agarose gel analysis of the product. (D) MMP-12 protein levels in culture supernatants at the final stage of differentiation were measured by ELISA. (E) Caseinolytic zymography assay of culture supernatants of GM-MΦ and M-MΦ (left panel), and COS-7 cells transfected with or without an expression vector encoding MMP-12 (right panel). A control of RMPI medium with or without fetal bovine serum (FBS) was included in the left panel. The caseinolytic activity was revealed by the white staining over the blue background of total proteins stained with Coomassie Brilliant Blue. Statistical analysis of triplicates was calculated using the paired two-tailed Student t test and data are presented as mean ± SD. (*p < 0.05; **p < 0.01; ***p < 0.001).

