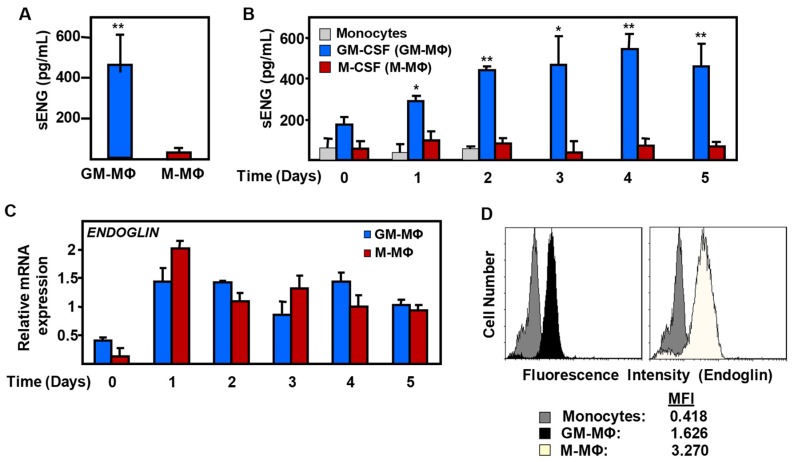
Figure 4.
Endoglin expression in GM-MΦ and M-MΦ. Human monocytes were incubated with GM-CSF or M-CSF, resulting in GM-MΦ and M-MΦ, respectively. Soluble endoglin (sEng) levels were measured by ELISA in culture supernatants at the final stage of differentiation (A) or during a kinetic study (B). In panel B, the statistical significance with respect to the control sample (day 0) is indicated. (C) Comparative mRNA expression levels of endoglin along GM-MΦ and M-MΦ polarization, as determined by qRT-PCR. (D) Endoglin protein levels at the surface of GM-MΦ and M-MΦ were detected by immunofluorescence flow cytometry using a mouse monoclonal antibody directed against human endoglin. Values of mean fluorescence intensity (MFI) are indicated. Statistical analysis was calculated using the paired two-tailed Student t test (n = 3), and data are presented as mean ± SD. (*p < 0.05; **p < 0.01).

