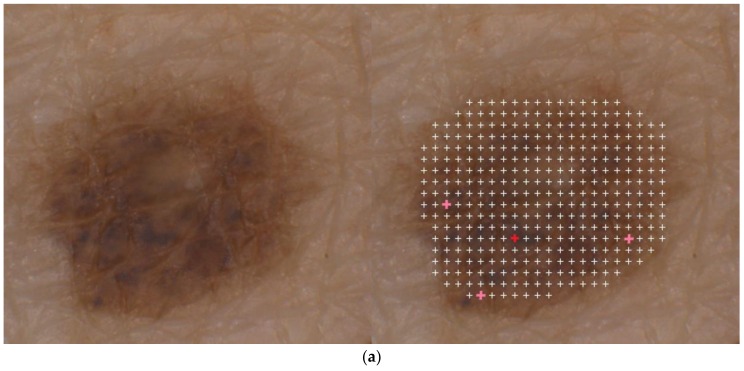
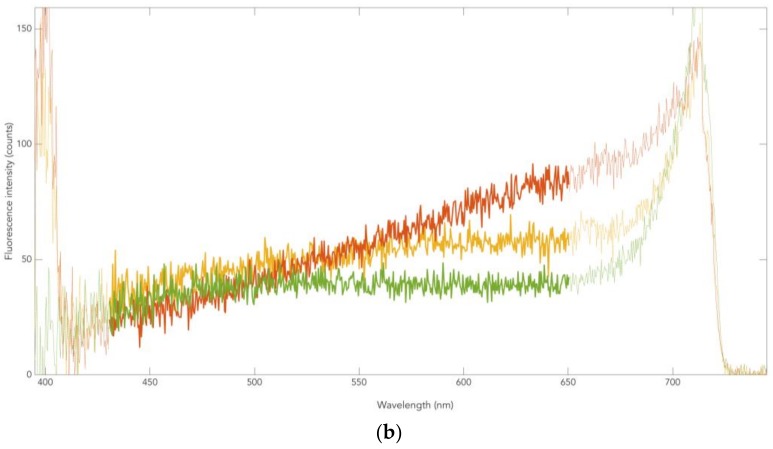
Figure 4.
Dermatofluoroscopy of a nevus from a Parkinson patient: (a) location of the measuring grid on the nevus, the grid pitch is 200 µm; (b) representative melanin-dominated spectra of this nevus. Green line: fluorescence from nevomelanocytes of a benign nevus area. Yellow line: fluorescence corresponding to that from nevomelanocytes of a dysplastic nevus area. Red line: fluorescence corresponding to that from melanoma cells. The wavelength (horizontal line) is given in nanometers (nm), counts of fluorescence intensity on the vertical line.


