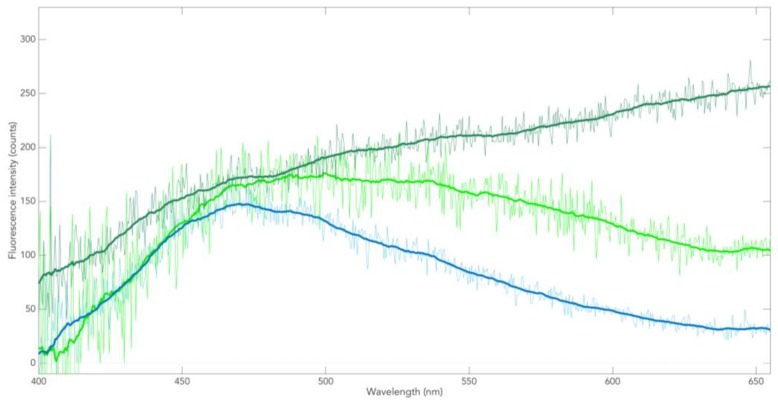
Figure 6.
Examples of fluorescence spectra of postmortem SNpc of control case. The blue line represents a spectrum from a largely neuromelanin (NM)-free region; this fluorescence is the tissue autofluorescence from NAD(P)H. The other two spectra represent—from light to dark green—increasing contribution of NM fluorescence to the autofluorescence; the dark-green lined spectrum results from regions with maximum NM content.

