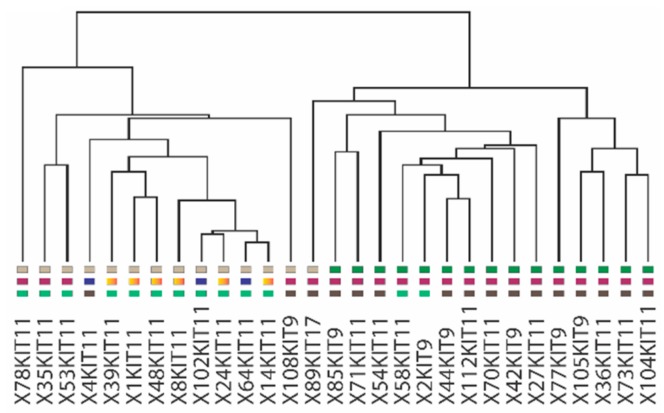
Figure 3.
Supervised hierarchical clustering based on differential gene expression discriminates imatinib-naïve (IM-n) and imatinib-resistant (IM-r) gastrointestinal stromal tumor (GIST) samples. Transcript expression profiles were determined using the Affymetrix platform (U133 plus 2) of 29 fresh frozen samples derived of IM-n (n = 14) and IM-r (n = 15) GISTs. Depicted is the cluster tree of a supervised hierarchical clustering based on 352 significant (p < 0.008, False Discovery Rate (FDR) < 10%), differentially expressed transcripts. Note that 100% of the IM-r samples are clustered together with a single IM-n GIST sample. The colored squares beneath the graph designate imatinib-naïve and imatinib-resistant samples, the malignancy risk and location of the tumors (see Figure 1). Note that the sample codes below also indicate which KIT exon is mutated.

