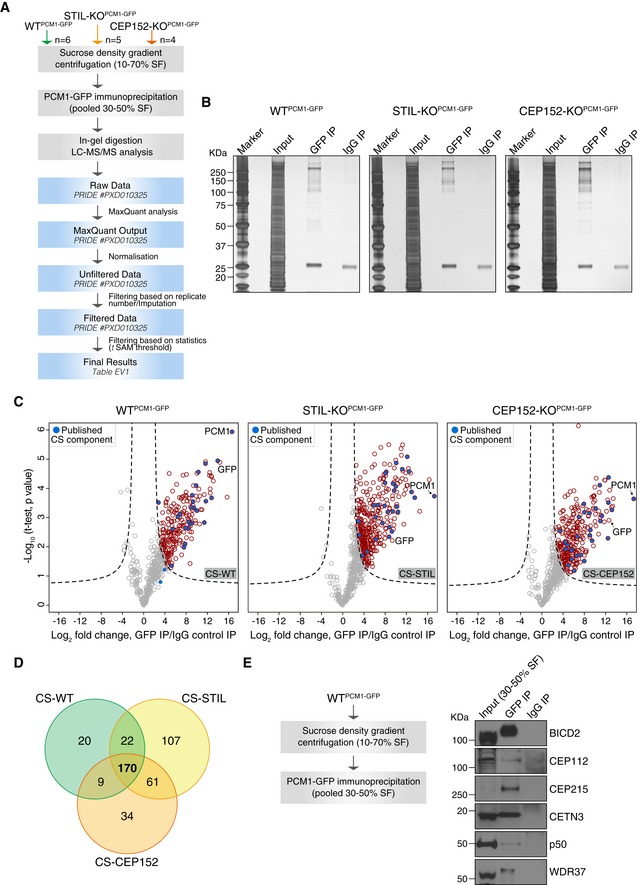
Figure 2. Label‐free mass spectrometry analysis of centriolar satellite proteomes from wild‐type and acentriolar cells.

- Experimental workflow of satellite isolation and proteomic analysis. Number of biological replicates per genotype is indicated. SF: sucrose fraction.
- Representative silver‐stained gels of GFP or IgG immunoprecipitation (IP) from pooled 30–50% sucrose fractions of WTPCM1‐GFP, STIL‐KOPCM1‐GFP and CEP152‐KOPCM1‐GFP cells. 0.5% of input and 5% of the IP samples were loaded.
- Volcano plots showing quantitative label‐free mass spectrometry data from WTPCM1‐GFP (left panel), STIL‐KOPCM1‐GFP (middle panel) and CEP152‐KOPCM1‐GFP (right panel) cell lines. Red circles correspond to hits significantly enriched in GFP vs. IgG pull‐downs. Previously described satellite components, including PCM1, are shown in blue. Data were filtered to retain proteins detected in a minimum of 4/6 (CS‐WT), 3/5 (CS‐STIL) and 3/4 (CS‐CEP152) replicates.
- Venn diagram of the number of candidates identified in CS‐WT, CS‐STIL and CS‐CEP152. Multiple gene products associated with the same gene symbol have been collapsed into one.
- PCM1 co‐immunoprecipitates with satellite candidates in DT40 cells. Workflow is shown on the left. Western blots on right depict immunoprecipitation performed using a GFP antibody (GFP IP) or mouse IgG (IgG IP) on pooled 30–50% sucrose fractions from WTPCM1‐GFP cells. Blots were probed with antibodies as indicated. 1% of the input and 5% of the pull‐down samples were loaded.
