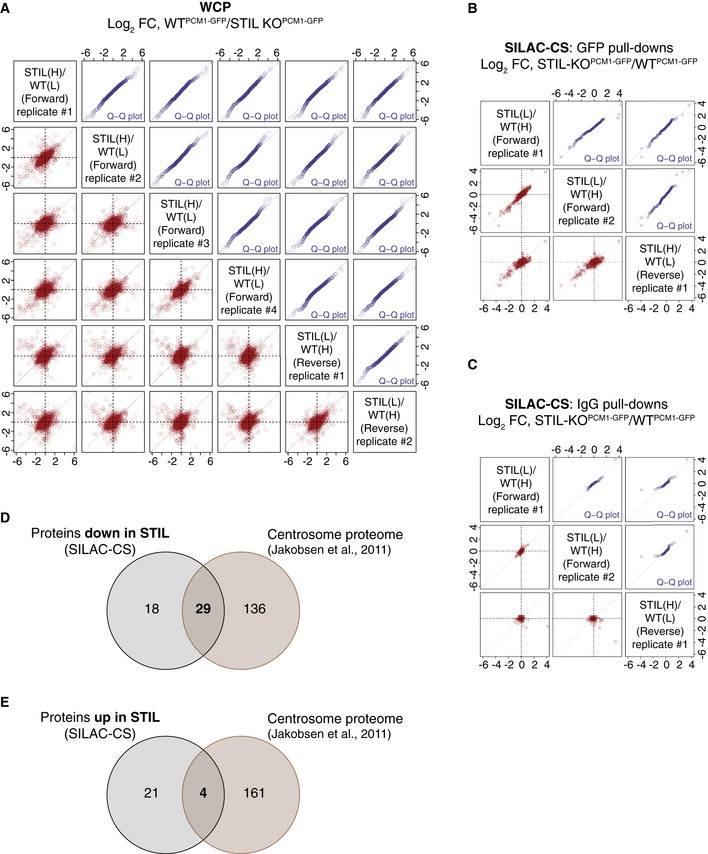
Figure EV4. SILAC‐based quantitative MS analyses of whole‐cell and centriolar satellite proteomes of WTPCM 1‐ GFP and STIL‐KOPCM 1‐ GFP cell lines.

-
AReproducibility of SILAC‐WCP experiments.
-
B, CReproducibility of SILAC‐CS experiments. Scatterplots (in red) showing the reproducibility and quantile–quantile plots (in blue) showing similar ratio distribution between the replicates, for the GFP pull‐downs (B) and the IgG CT pull‐downs (C). Protein ratios of the reverse experiment have been inverted.
-
DVenn diagram showing the overlap between the proteins down‐regulated in SILAC‐CS‐STIL and the centrosome proteome dataset (Jakobsen et al, 2011).
-
EVenn diagram showing the overlap between the proteins up‐regulated in SILAC‐CS‐STIL and the centrosome proteome dataset (Jakobsen et al, 2011). Note that centrosomal proteins are under‐represented among the up‐regulated proteins.
