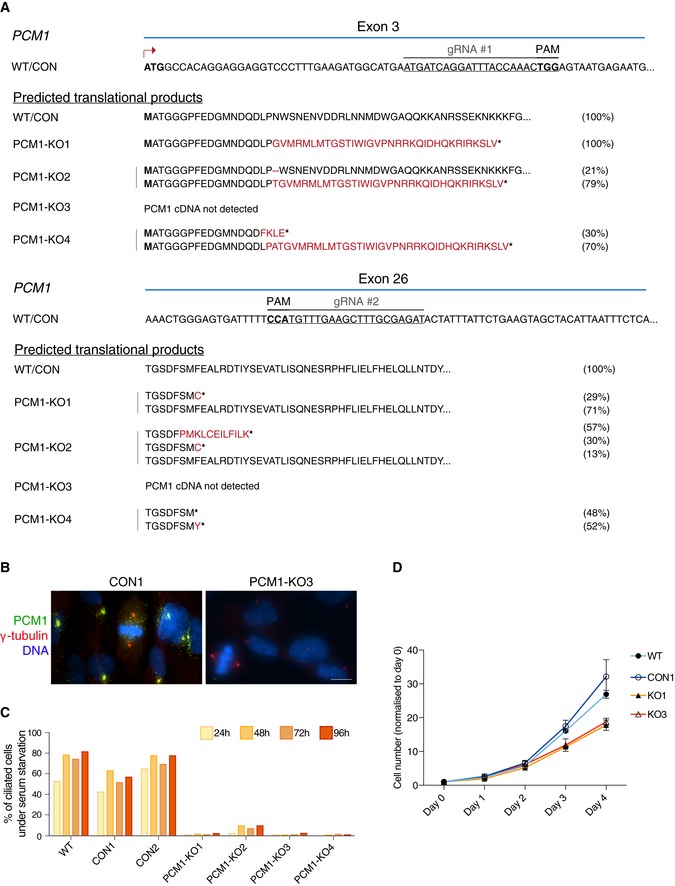
Figure EV5. Characterisation of PCM1‐KO cell lines.

- CRISPR/Cas9 strategy to generate PCM‐deficient cells. The PAM sequences are highlighted in bold. Target sequences in exons 3 and 26 are shown. Below, predicted translational products from all the sequenced variants are listed. Briefly, PCM1 variants were identified by amplifying and sequencing the regions of PCM1 cDNA targeted by the gRNAs. Amino acids deleted are represented by the dash symbol, those divergent from the control sequence are highlighted in red, whereas stop of translation is represented by the asterisk. For each clone, 10–25 bacterial colonies were sequenced. The percentage of each transcript variant/translational product is indicated at the right of each panel. For PCM1‐KO 3, the PCM1 cDNA sequence was not detected.
- Representative immunofluorescence images of PCM1 control (CON 1) and KO (KO 3) cells co‐stained with antibodies against PCM1 (green) and γ‐tubulin (red). DNA is in blue. Images correspond to maximum intensity projections of wide‐field micrograph. Scale bar: 10 μm.
- Bar chart depicts the percentage of ciliated cells in RPE‐1 WT cells, control (CON) and PCM1‐KO clones, after serum starvation. Cells were scored at 24, 48, 72 and 96 h after serum starvation. 200–400 cells were counted for each time‐point. Data shown corresponds to a single experiment.
- Graph showing the rate of cell growth in the various genotypes. Numbers were normalised to day 0. WT: parental cell line; CON: control clone; KO: PCM1‐KO clones. n = 2 replicates are plotted as mean ± SD.
