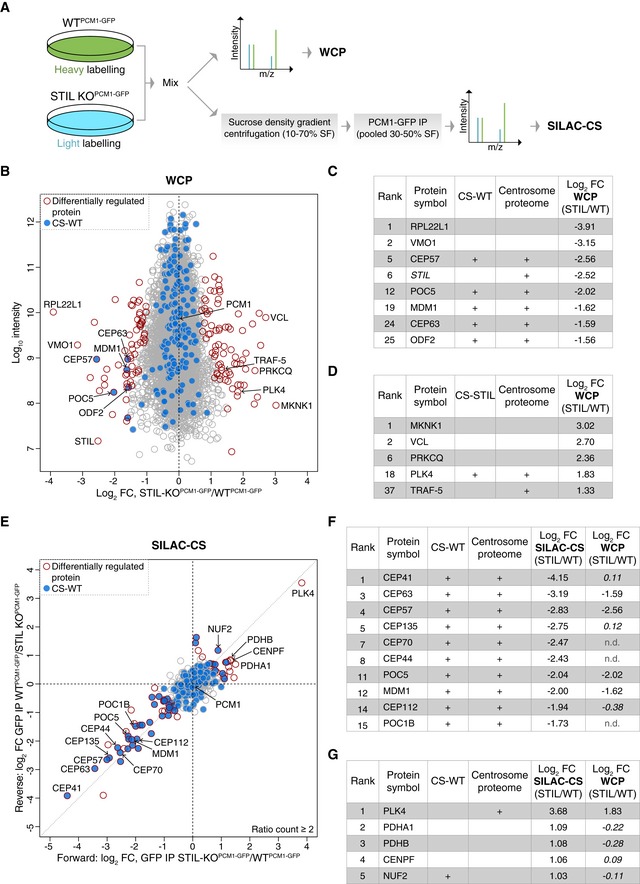
Figure 6. SILAC‐based quantitative analysis of whole‐cell and satellite proteomes of acentriolar cells.

- Experimental workflow of SILAC‐based MS analysis. Note that differentially labelled cells were mixed prior to the multistep CS purification process to minimise variability in sample preparation.
- Comparison of whole‐cell proteomes (WCP) of differentially labelled WTPCM1‐GFP and STIL‐KOPCM1‐GFP cells. Scatterplot shows the fold change in SILAC protein ratios. Proteins with significant changes in abundance between WTPCM1‐GFP and STIL‐KOPCM1‐GFP cells are shown as red circles [determined using Significance B with protein ratios stratified according to protein intensity (Cox & Mann, 2008)], whereas proteins previously identified in CS‐WT are in blue.
- Table shows list of proteins reduced in WCP‐STIL, ranked according to fold change. In addition to the two proteins with the greatest log2 fold change, all significantly down‐regulated centrosomal and/or satellite proteins are included. Note that the “re‐quantify” function of MaxQuant enabled assignment of SILAC ratios to proteins with infinity ratios (i.e. STIL in STIL‐KO).
- Table shows list of proteins elevated in WCP‐STIL, ranked according to fold change. PLK4 is the most significantly up‐regulated centrosomal protein.
- Comparison of satellite proteomes isolated from differentially labelled WTPCM1‐GFP and STIL‐KOPCM1‐GFP cells. Scatterplot shows the fold change in SILAC protein ratios. The x‐axis corresponds to the forward, whereas the y‐axis to the reverse experiments. Proteins with significant changes in abundance between satellite isolated from WTPCM1‐GFP and STIL‐KOPCM1‐GFP cells are shown as red circles [obtained by Significance A parameter (Cox & Mann, 2008)], whereas those previously identified in CS‐WT are in blue.
- Table shows list of proteins reduced in SILAC‐CS‐STIL and their corresponding fold change in the WCP. They are ranked according to fold change. Changes that are not significant are depicted in italics; n.d.: not detected.
- Table shows list of proteins elevated in SILAC‐CS‐STIL and their corresponding fold change in the WCP. They are ranked according to fold change. Changes that are not significant are depicted in italics.
