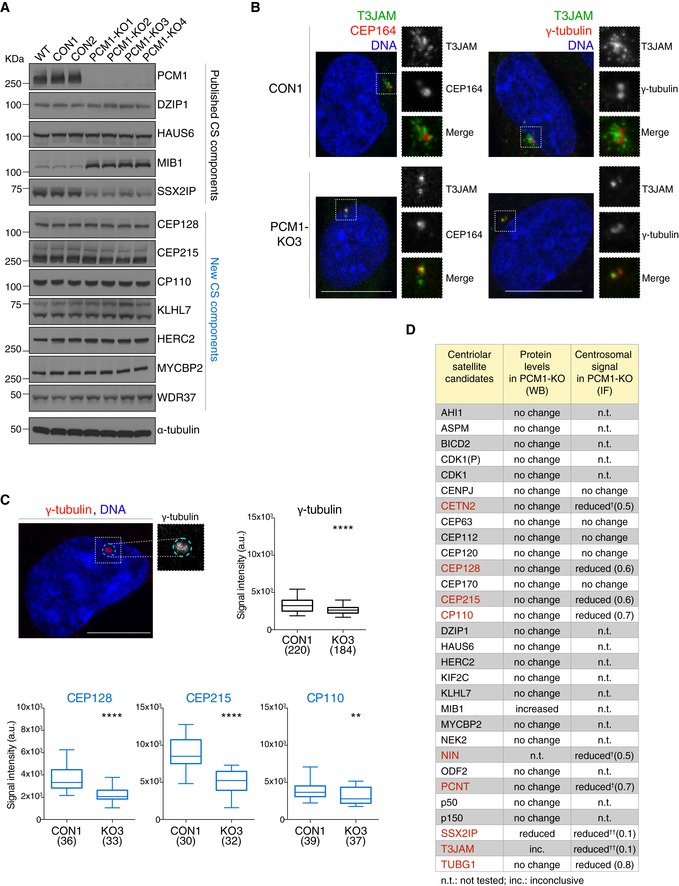
Figure 7. Differential effects of PCM1 loss on steady‐state expression and centrosomal localisation of satellite components.

- Western blots show levels of known satellite components and satellite candidates (from CS‐WT) in control (CON) and PCM1 knock‐out (KO) RPE‐1 cell clones. Western blots of further candidates are included in Appendix Fig S3. WT corresponds to parental RPE‐1 cells. α‐tubulin served as loading control.
- Representative immunofluorescence images of T3JAM localisation in control (CON) and PCM1‐KO (KO3) cells. Higher magnifications of framed areas are shown in right panels. Cells were co‐stained with antibodies against T3JAM (green) and CEP164 (red), or T3JAM (green) and γ‐tubulin (red), as indicated. DNA is in blue. Images correspond to the maximum intensity projection of the confocal micrograph. Scale bar: 10 μm.
- Quantification of centrosomal enrichment of satellite candidates in PCM1‐KO cells. As illustrated by the dotted line shown in cyan in the representative confocal image, signal intensities were measured on maximum intensity projection images within a circle encompassing the centrosome as defined by γ‐tubulin‐positive staining (γ‐tubulin is shown in red, DNA in blue). Box plots show total centrosomal signal intensities of satellite candidates (CEP128, CEP215 and CP110) in control (CON1) and PCM1‐KO (KO3) cells. Boxes represent interquartile ranges, lines in boxes the medians, and whiskers indicate the 5th–95th percentiles. P values were obtained by the Mann–Whitney U test (**P ≤ 0.01; ****P ≤ 0.0001; n.s.: not significant); the number of cells analysed is reported in parentheses.
- Table summarises protein levels and centrosomal signals of satellite candidates in PCM1‐KO cells (primary data in (A), (B) and Appendix Fig S3). Proteins with change in centrosomal signal (P value of 0.01 or less, Mann–Whitney test) are shown in red. Numbers in parentheses depict fold changes in centrosomal signal intensities. †Satellite components centrin 3 (CETN3), ninein (NIN) and pericentrin (PCNT) were included as positive controls (Dammermann & Merdes, 2002). ††For proteins with prominent satellite localisation (SSX2IP and T3JAM), reduction in centrosomal signal in PCM1‐KO may correspond to loss of pericentrosomal satellites.
